Dogecoin (DOGE) Price Jumps 128% in a Month Amid 11-Year Celebration
Dogecoin's 128% rally in the last 30 days celebrates its 11-year milestone. Mixed signals now suggest potential consolidation or a correction.
Dogecoin (DOGE) price has recently seen significant growth, up 128% in the last 30 days, marking a major milestone as it celebrates 11 years since its launch in 2013 by Billy Markus and Jackson Palmer. As the largest meme coin in the market, with a market cap approaching $65 billion, DOGE continues to hold strong attention.
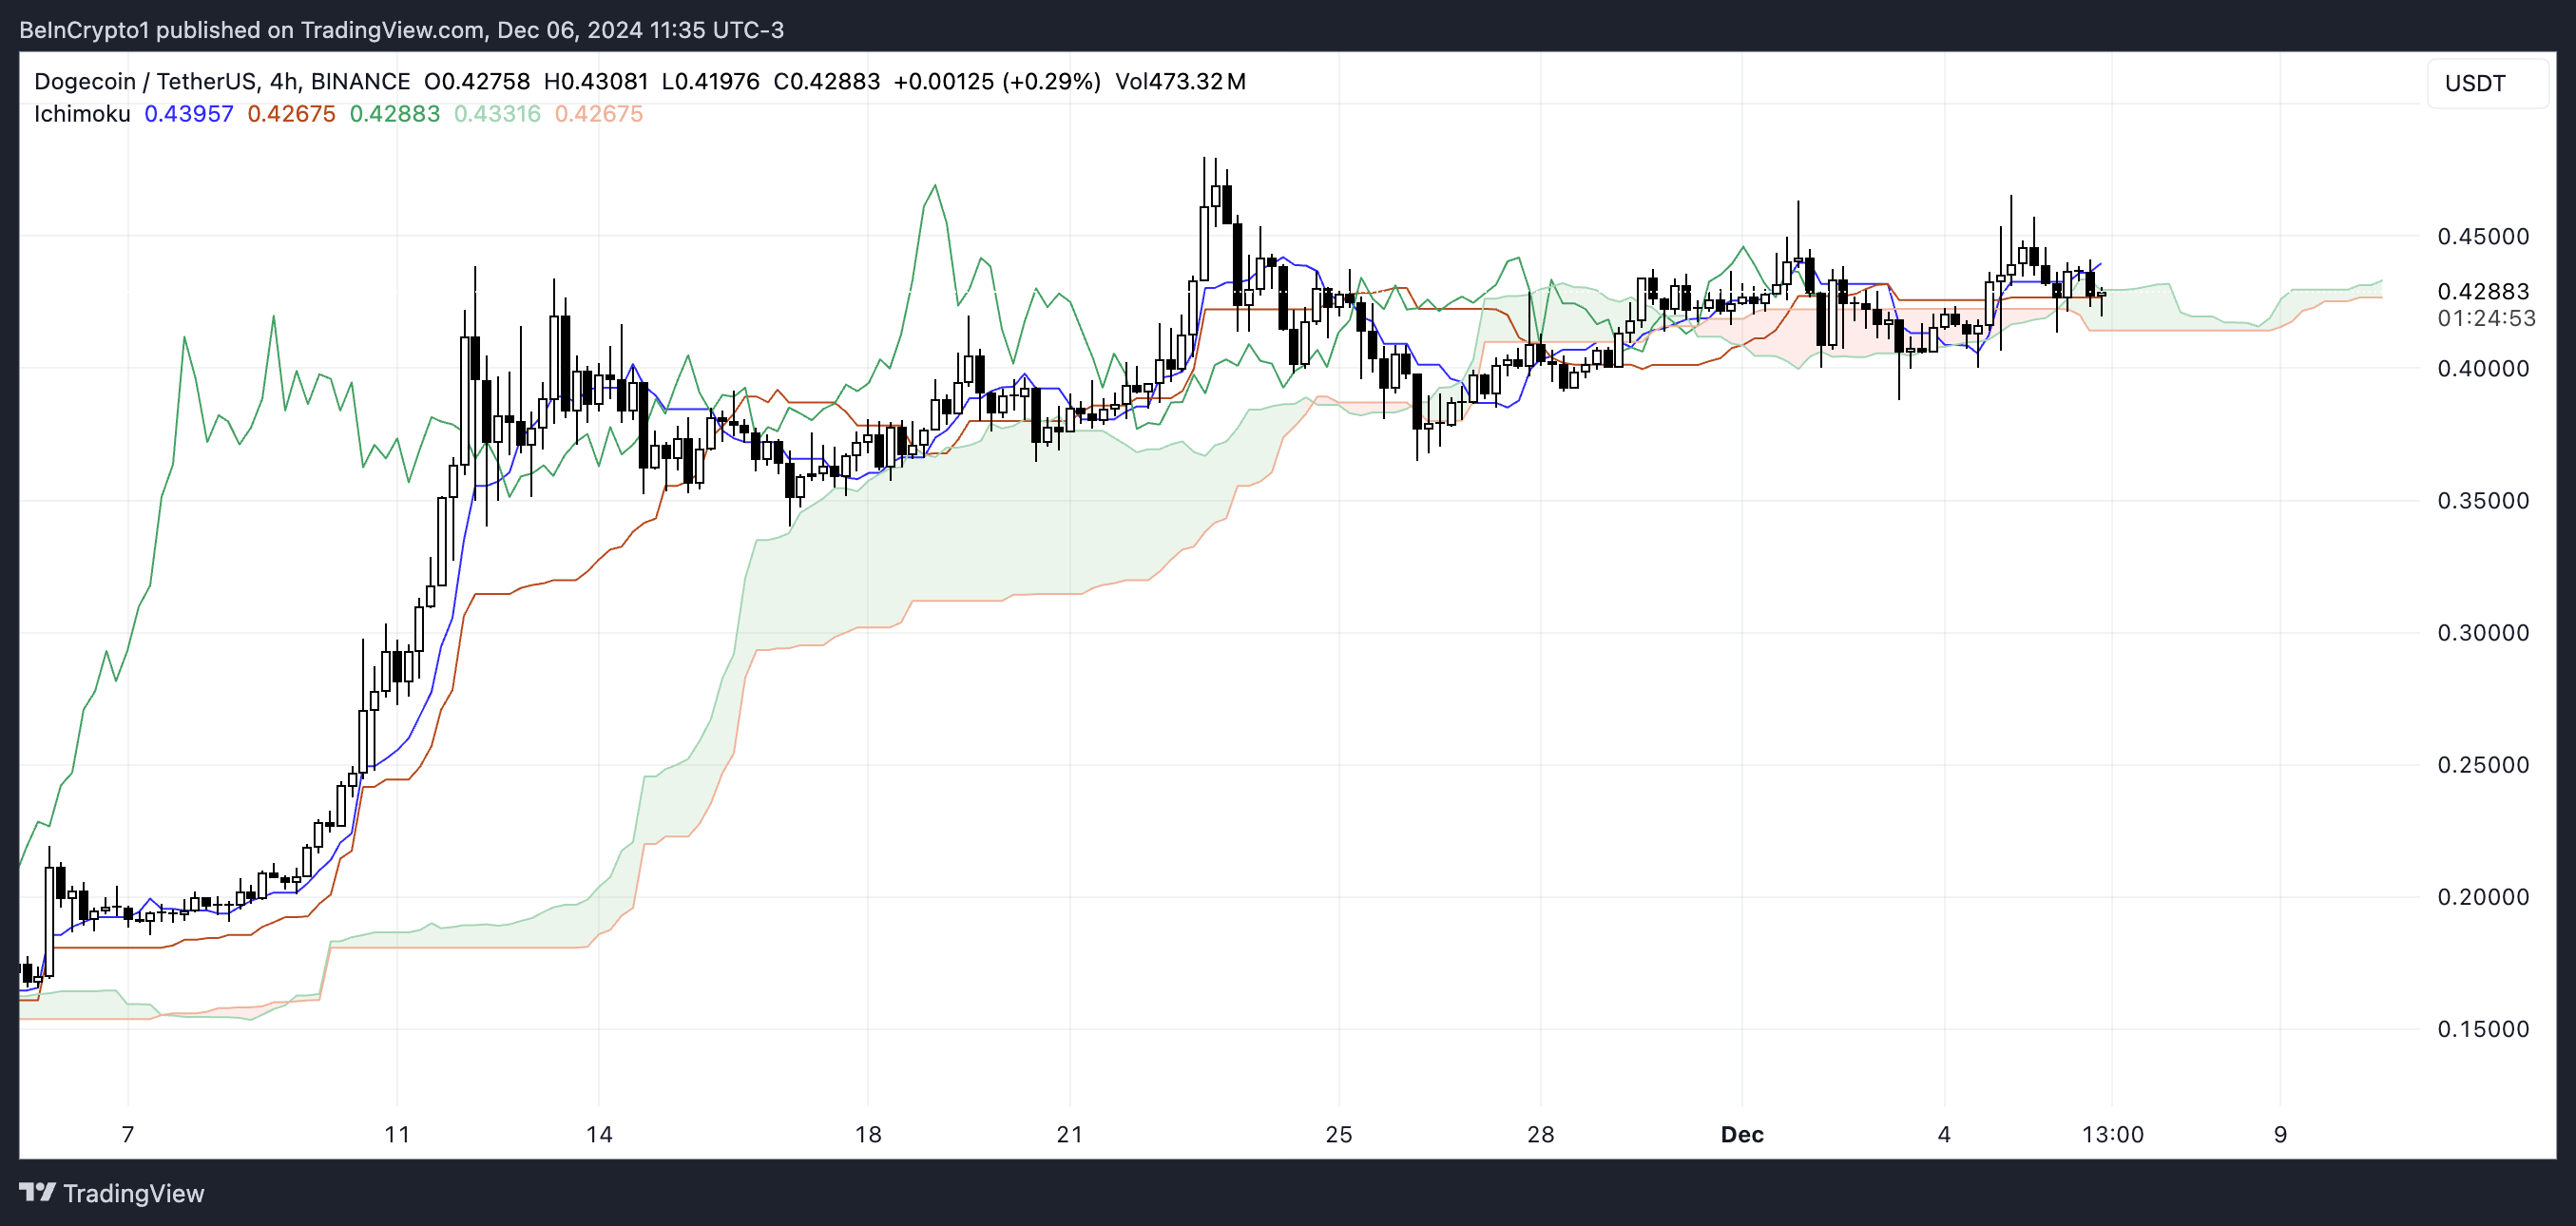
However, the DOGE Ichimoku Cloud chart is showing mixed signals. While the price remains above the cloud, indicating favorable market sentiment, the narrowing distance between the price and the cloud suggests potential volatility, which could either lead to continued gains or a reversal depending on future price action.
DOGE Ichimoku Cloud Shows Mixed Signals
The DOGE Ichimoku Cloud chart shows an overall bullish trend with the price positioned above the cloud, indicating that the market sentiment is still favorable for Dogecoin.
The green line (Tenkan-sen) and the blue line (Kijun-sen) are above the red (Senkou Span A) and orange (Senkou Span B) lines, further suggesting upward momentum.
 DOGE Ichimoku Cloud. Source:
TradingView
The price remains above the cloud, a key signal for potential further gains. However, this distance is narrowing.
The recent consolidation near the top could signal either a continuation or a reversal, depending on how the price interacts with the cloud and the lines. If DOGE price were to fall below the cloud, this would suggest a bearish outlook.
Dogecoin Trend Could Turn Negative
The recent drop in DOGE’s ADX from above 30 to 15.2 indicates a weakening trend strength. An ADX below 20 generally signals a lack of trend momentum, suggesting that the recent bullish momentum behind DOGE is fading.
This decline in ADX suggests that the market may be entering a consolidation phase, with no clear trend direction, after a period of strong upward movement.
 DOGE DMI. Source:
TradingView
The Average Directional Index (ADX) measures the strength of a trend, regardless of whether it’s bullish or bearish. It ranges from 0 to 100, with values above 25 typically indicating a strong trend, and values below 20 signaling weak or no trend. With D+ at 18.7 and D- at 20.4, D- surpassing D+ signals that selling pressure is gaining strength.
Combined with the low ADX, this suggests that DOGE could be losing momentum, with the potential for a price pullback or further consolidation as selling pressure begins to outweigh buying activity.
DOGE Price Prediction: Will Dogecoin Fall Below $0.30?
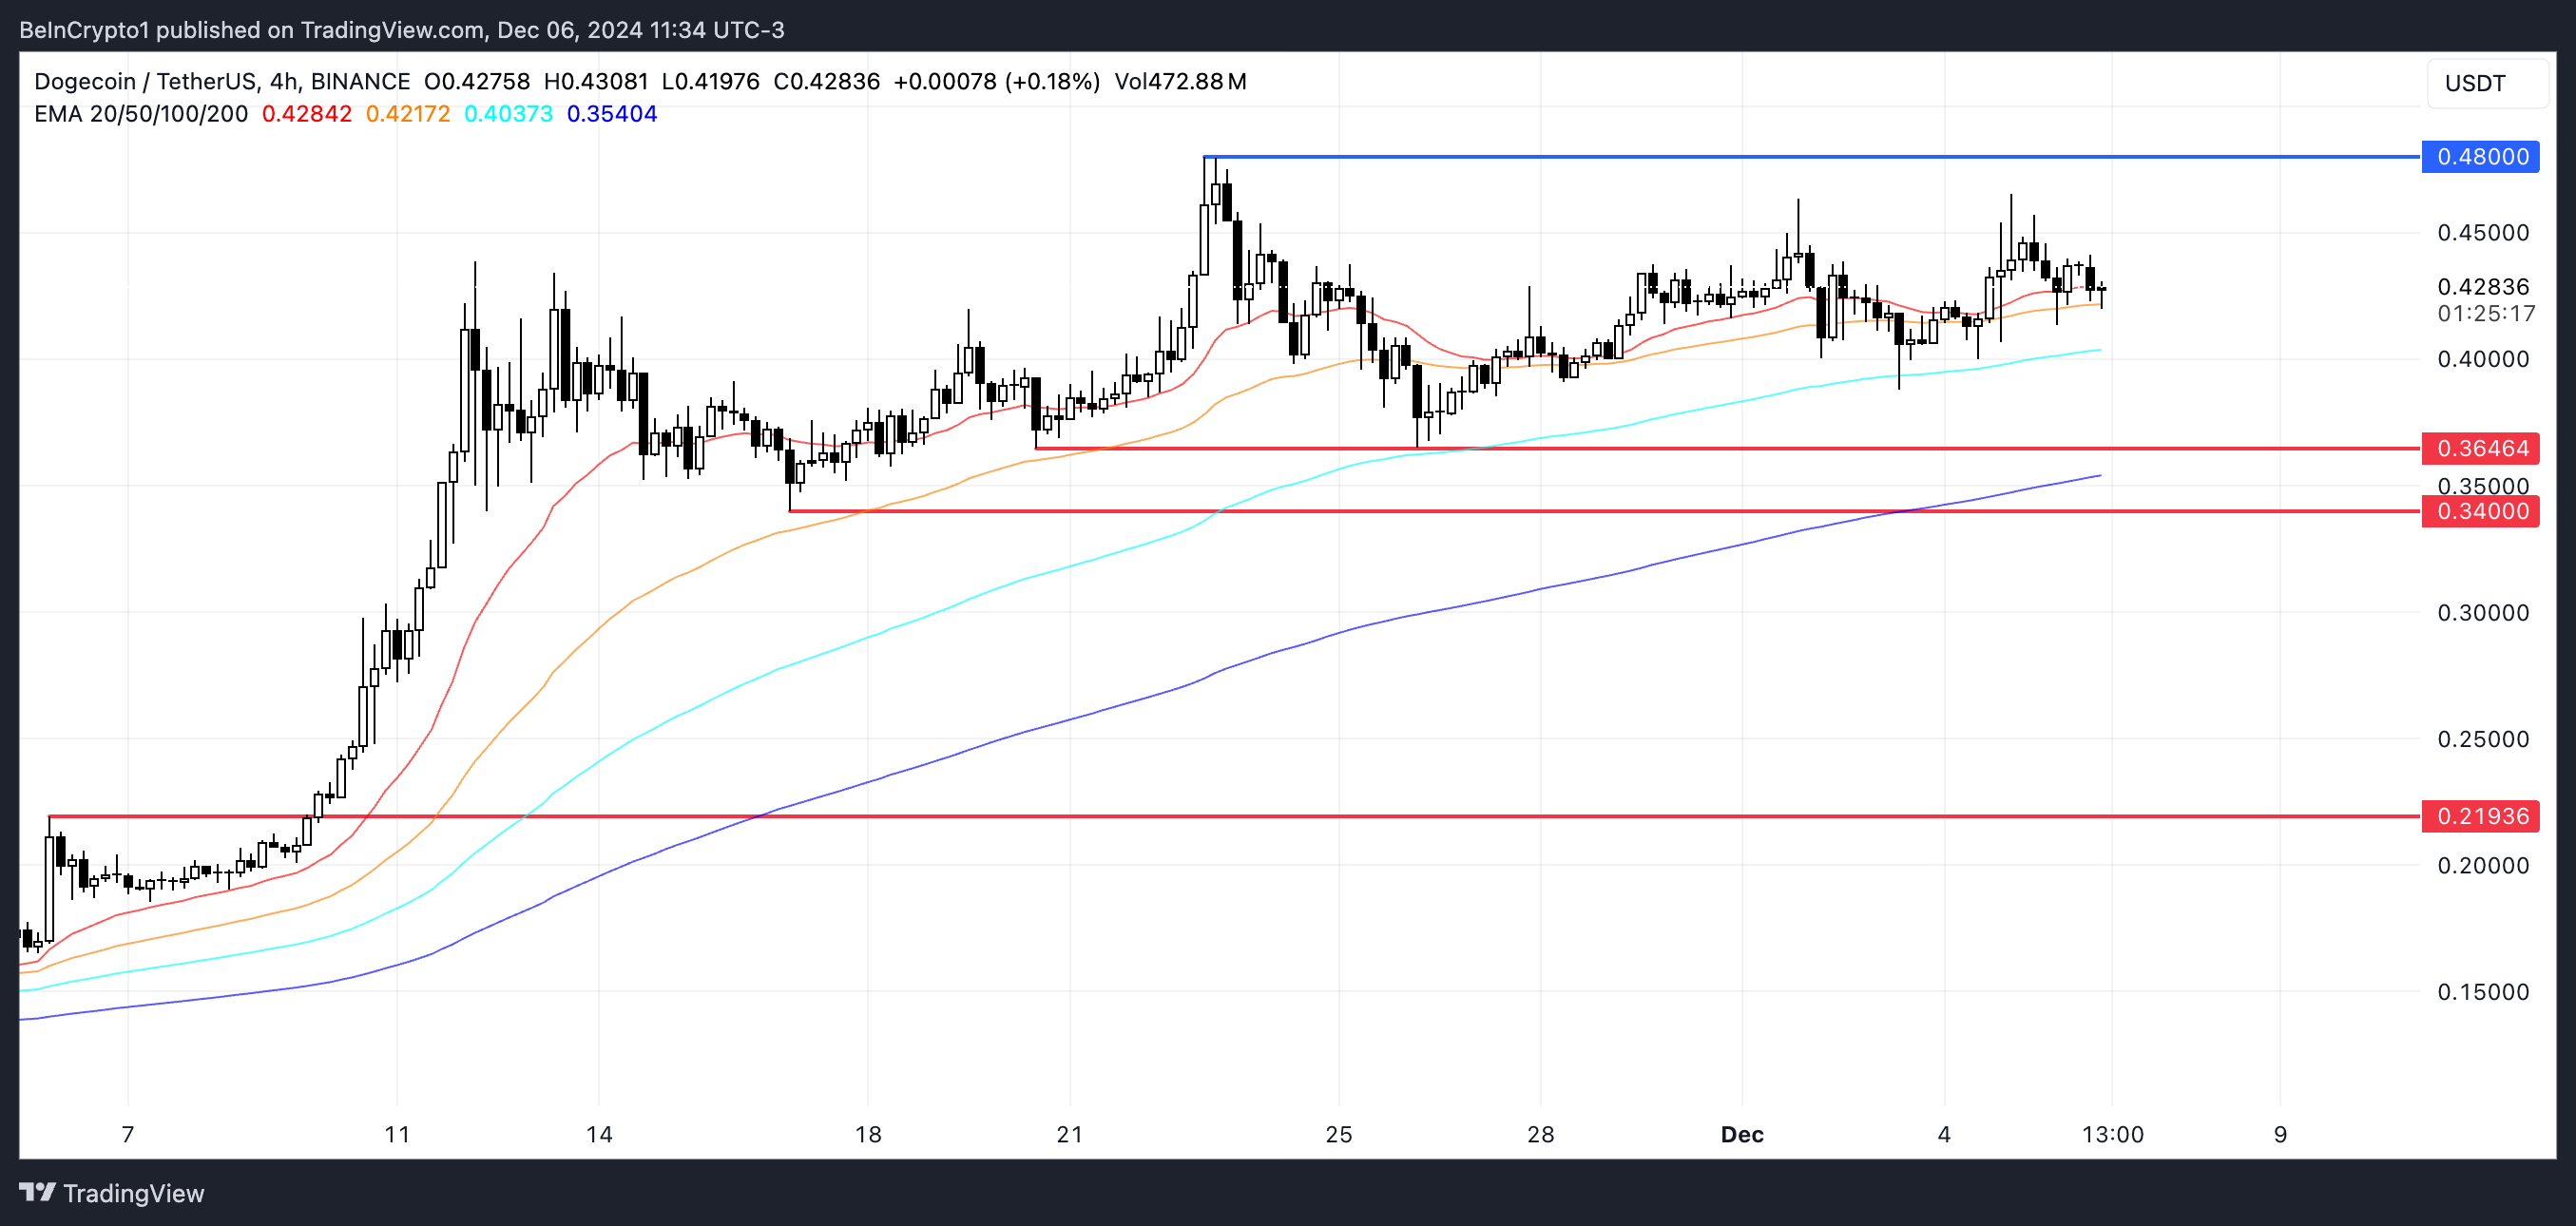
Dogecoin price could be facing a potential correction, as its short-term EMA lines are on the verge of crossing below one of the long-term EMA lines, which would form a death cross. A death cross typically signals a shift from an uptrend to a downtrend, and if this happens, DOGE price may see a decline.
The crossover of these lines indicates weakening bullish momentum and suggests that the price could face downward pressure in the near future.
 DOGE Price Analysis. Source:
TradingView
If the death cross does occur, DOGE price could first test support at $0.36 and $0.34. Should these levels fail to hold, the price could drop further, potentially reaching as low as $0.219.
However, if the uptrend continues and D+ (positive directional movement) strengthens over D- (negative directional movement), DOGE could regain bullish momentum and test the $0.48 level again, possibly even rising to $0.50 for the first time since 2021.
Disclaimer: The content of this article solely reflects the author's opinion and does not represent the platform in any capacity. This article is not intended to serve as a reference for making investment decisions.
You may also like
Bitcoin holds near $75,000 as markets absorb US tariff impact

North Carolina proposes $750B threshold for crypto tax use

Pakistan plans to use surplus electricity for Bitcoin mining

Founder charged with $40 million AI fraud

