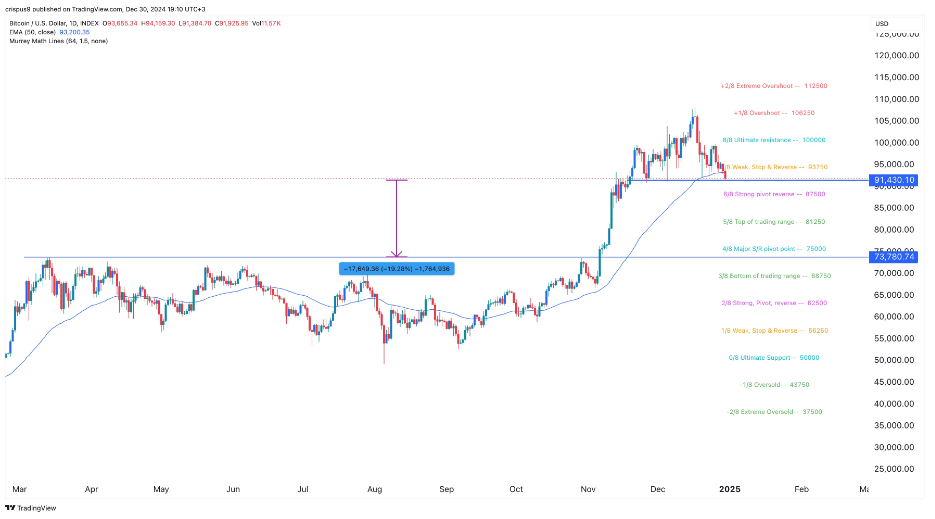
30 December Bitcoin traded at $92,000, down nearly 15% from this year's high, as technical indicators suggested the flagship currency could continue to slide.

The chart shows that BTC has broken above its 50-day exponential moving average in recent days and is now trying to break below key support at $91,430, which it has tested three times this month but failed to break.
Additionally, Bitcoin formed a head and shoulders pattern, a well-known bearish reversal indicator. As a result, the flagship kriptovalyuta may fall to the next major support level at $73,780, which was reached on March 14, 2024. This is about 20% lower than the current price.
Experts attribute the continued decline of Bitcoin to profit-taking by investors who have benefited from its more than twofold growth this year. The decline is also associated with a risk-off trend in the market, as evidenced by the rise of the US dollar index to $108,14 and a significant drop in the Dow Jones and Nasdaq 100 indices by 670 and 320 points, respectively.
MicroStrategy's latest acquisitions also failed to affect the BTC rate. Tether , which at the end of the year replenished their Bitcoin - assets for 7630 and 2138 coins respectively.
