Hidden Bullish Divergence Hints at Major Breakout, Bitcoin’s Secret Signal?

- Bitcoin’s hidden bullish divergence signals a potential breakout, mirroring past rallies with nearly 90% price surges
- Bitcoin dominance faces strong resistance, hinting at a market shift as past patterns suggest a temporary pullback before a surge
- Historical trends and momentum indicators align, reinforcing Bitcoin’s bullish outlook and potential for a strong upward move
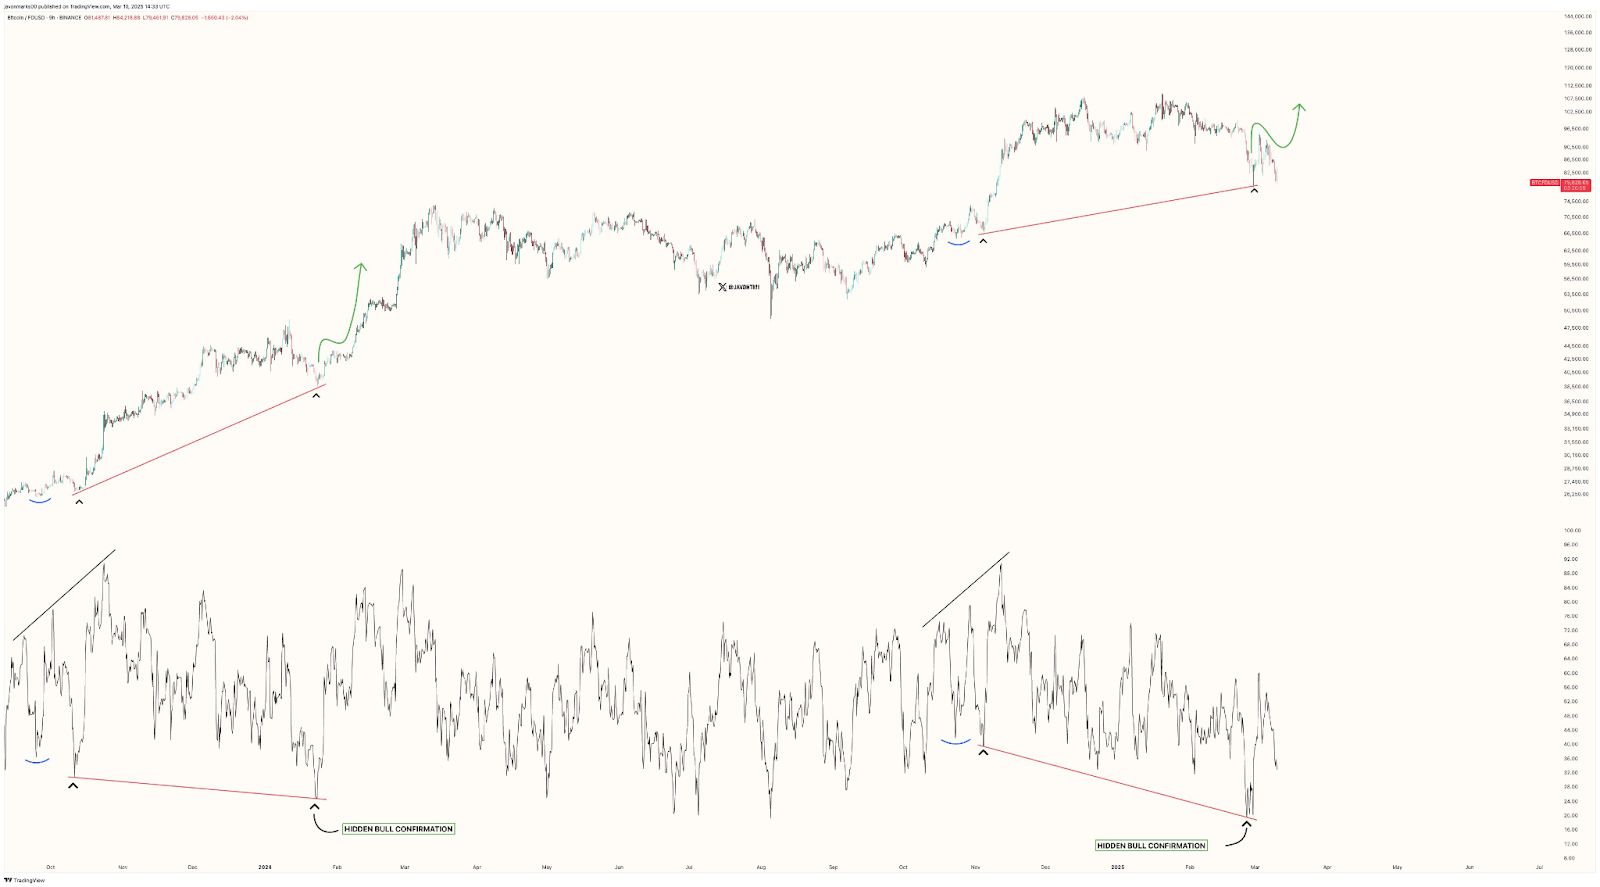
Analyst JavonMarks highlights a hidden bullish divergence for Bitcoin that previously led to a nearly 90% price surge. This indicator signals a strong continuation pattern, suggesting Bitcoin could be on the verge of another powerful upward move.
Source: Javon Marks
Hidden Bullish Divergence Points to a Price Surge
Bitcoin shows a series of higher lows , indicating resilience in the face of market swings. When the price of Bitcoin stays the same or increases, the oscillator makes lower lows. This validates the dependable indicator of an impending rise, hidden bullish divergence.
Furthermore, previous bullish confirmations that led to price gains are indicated by green arrows. These indicators have supported Bitcoin’s bullish trend by coming before higher movements. Another possible price breakthrough is implied by the recent correction’s stabilization close to a significant trendline.
Bitcoin Dominance Faces Resistance, Suggesting Market Rotation
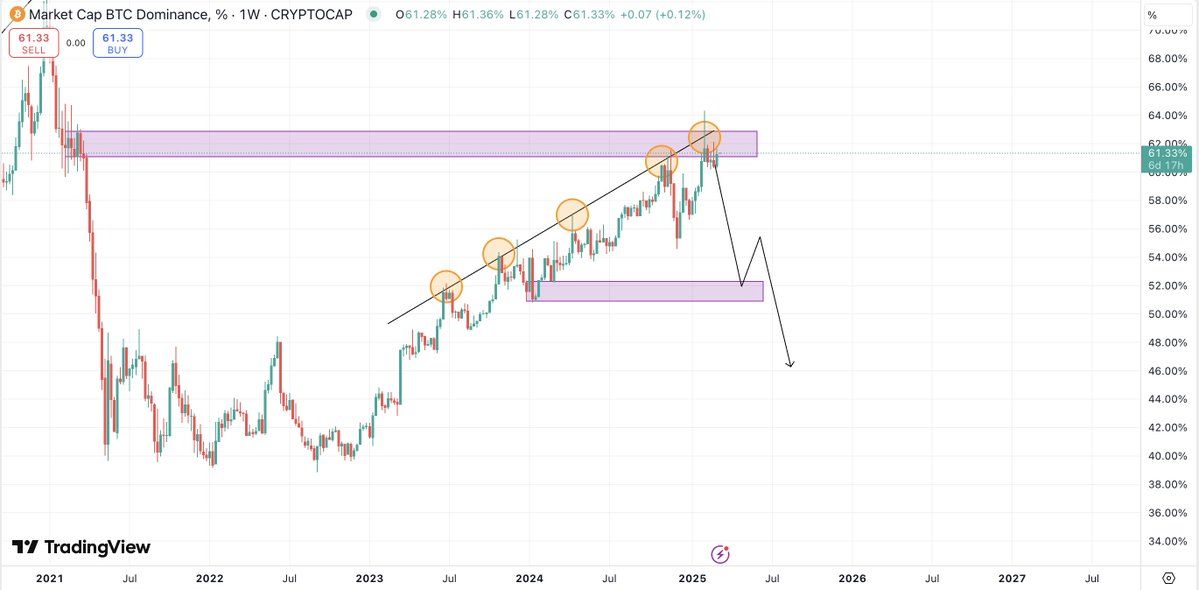
Crypto Fella Shows Bitcoin dominance rising since mid-2022, forming higher lows and maintaining an upward trajectory. However, it recently encountered a strong resistance zone, marked by a purple box on the chart. This level has historically triggered selling pressure, leading to pullbacks.
Source: Crypto Fella
Currently, Bitcoin dominance has slightly broken above this trendline but is now facing rejection. A downward projection suggests potential weakness, with dominance likely to drop toward a lower support zone. If this level fails to hold, further declines toward the 50% dominance level could follow.
Market Momentum Aligns with Historical Patterns
The historical trend reveals that Bitcoin dominance has repeatedly tested this resistance before pulling back. Previous rejections led to lower supports before dominance resumed its upward movement. This suggests that the market could be entering a phase of temporary weakness before another strong push.
Moreover, the structure of Bitcoin’s price action remains bullish. Each hidden bullish divergence confirmation has historically resulted in price appreciation. The oscillator’s behavior further supports this upward trajectory, showing momentum shifts before major price surges.
Disclaimer: The content of this article solely reflects the author's opinion and does not represent the platform in any capacity. This article is not intended to serve as a reference for making investment decisions.
You may also like
Analyst: US CPI data could push US bond yields in either direction
Bitget Spot Bot adds OIK/USDT
OIKUSDT now launched for futures trading and trading bots
Megabit will launch BROCCOLI/USDT 1-75x perpetual contract at 18:00 (SGT TIME)