Can MOVE Sustain Its Gains with Weak Buying Pressure?
- Movement (MOVE) trades at $0.4932, marking a 1.22% increase in the last 24 hours.
- A breakout above $0.5092 could push MOVE toward $0.55.
Movement (MOVE) is trading at $0.4932, gaining 1.22% in the past day. The market cap stands at $1.18 billion, reflecting the same percentage increase. The trading volume surged 55.88%, reaching $379.63 million in 24 hours. The fully diluted valuation (FDV) is $4.93 billion, with a 32.26% market cap ratio. MOVE’s circulating supply is 2.4 billion out of a 10 billion total supply.
Technical Indicators and Price Outlook
The 4-hour chart from TradingView shows MOVE facing resistance and support at key levels. Immediate resistance stands near $0.5092, while support is forming at $0.4895. If resistance breaks, MOVE could rise toward $0.55. A drop below support may lead to $0.45.
The Relative Strength Index (RSI) is at 51.95, hovering near the neutral zone. Its moving average is 50.50, suggesting weak momentum. The RSI indicates a balanced market with neither overbought nor oversold conditions.
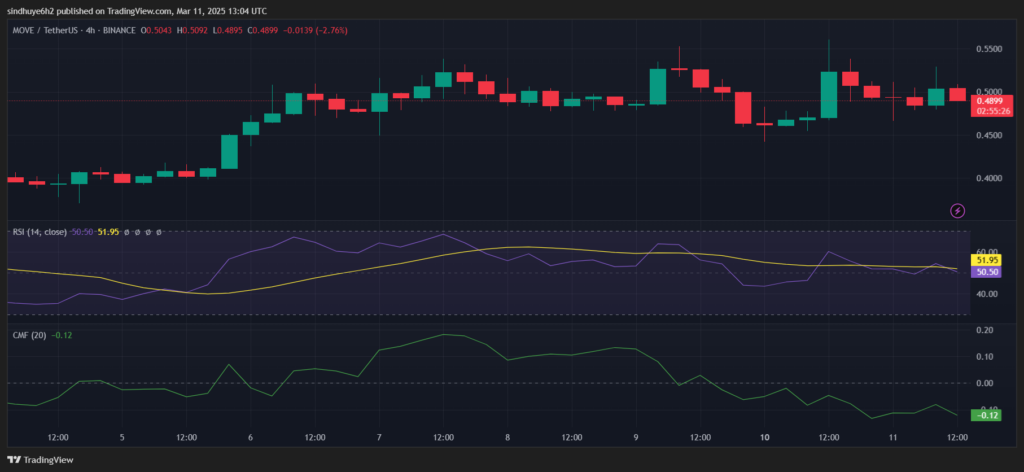
The Chaikin Money Flow (CMF) is negative at -0.12, signaling outflows and declining buying pressure. If CMF remains negative, MOVE may struggle to sustain gains.
Moving averages (MA) show mixed trends. Short-term MA is trending near $0.50, while long-term MA stays above, indicating consolidation. A crossover could confirm a stronger breakout or downturn.
MOVE’s price action depends on breaking resistance or holding support. A bullish breakout above $0.5092 could trigger further gains. However, declining CMF suggests caution. Traders should watch for increased volume and a positive RSI shift before confirming upward momentum.
Highlighted Crypto News Today
Coinbase Eyes Indian Market Again with FIU Registration Complete
Disclaimer: The content of this article solely reflects the author's opinion and does not represent the platform in any capacity. This article is not intended to serve as a reference for making investment decisions.
You may also like
Inflation print calms markets, but tariffs still loom
Commerce Secretary Howard Lutnick said tariffs are “worth it” even if they plunge the US economy into recession territory

XRP News: XRPTurbo Set To Enhance XRP DeFi Ecosystem With AI-Powered DApps And Tokenization Tools
‘Markets Are Gonna Soar’: Trump Shows Confidence as Inflation Cools and Stocks Rise
An FTX/Alameda-associated address released 185,000 SOL stakes