APT and ATOM Hold Key Support After Major Decline – Can This Pattern Spark a Recovery?

Date: Fri, March 14, 2025 | 11:10 AM GMT
The cryptocurrency market is showing signs of stabilization after experiencing a significant downtrend following the late 2024 rallies. Among the hardest-hit altcoins , Aptos (APT) and Cosmos (ATOM) have suffered sharp corrections—APT plunging 62% and ATOM dropping 55% over the last 90 days, shaking investor confidence.
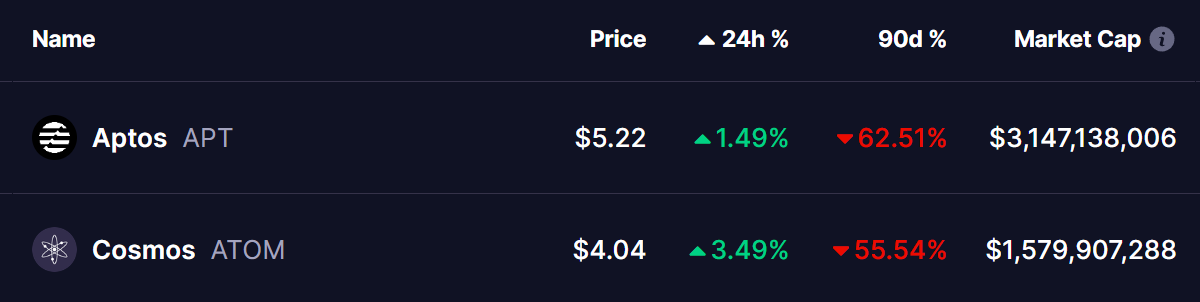 Source: Coinmarketcap
However, both assets are now holding at key support levels and forming a double bottom pattern, a historically bullish reversal structure that could set the stage for recovery.
Aptos (APT) Analysis
APT’s weekly chart signals the formation of a double bottom pattern, which emerged after the price failed to sustain above the $12.06 resistance in early December 2024. That rejection led to a sharp downturn, pushing APT back down to $5.0, marking the second bottom of the pattern.
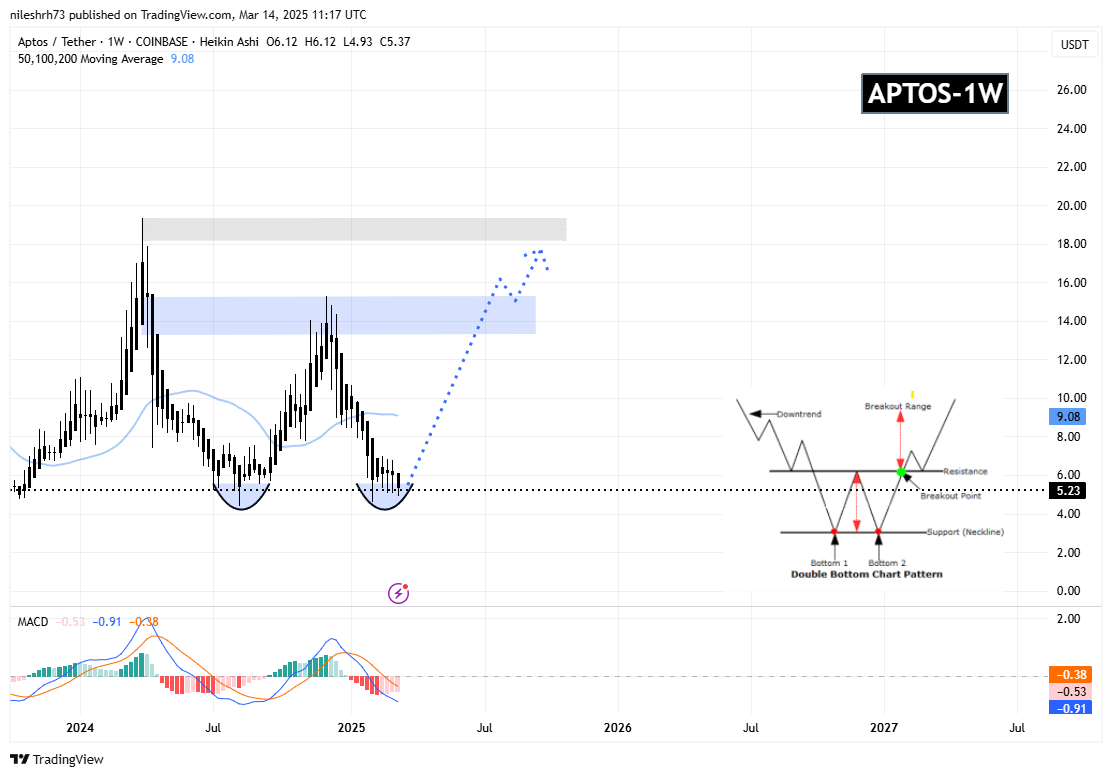 Aptos (APT) Weekly Chart/Coinsprobe (Source: Tradingview)
Encouragingly, buyers have defended this level, leading to a small rebound, with APT currently trading around $5.23. This suggests that demand is returning at this critical support zone.
Adding to this bullish outlook, the MACD (Moving Average Convergence Divergence) indicator is showing early signs of a bullish crossover, which historically signals a shift in momentum in favor of buyers.
If this pattern plays out, APT could retest the $12.06 neckline resistance in the coming weeks. A decisive breakout above this level could confirm the trend reversal, potentially sparking a strong rally toward the $20+ range in the coming months.
Cosmos (ATOM) Analysis
ATOM is following a similar trajectory to APT, forming a double bottom pattern after failing to break the $10.67 resistance in early December 2024. Since then, ATOM has revisited the $3.75 support, marking the second bottom of the pattern.
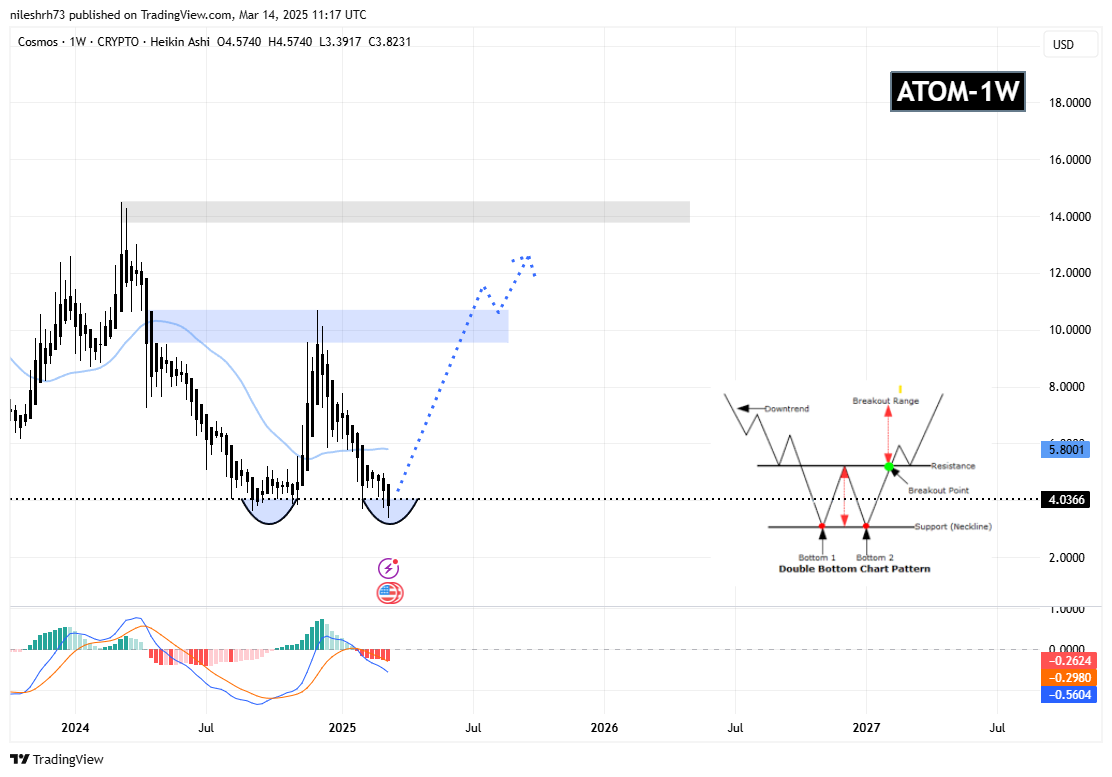 Cosmos (ATOM) Weekly Chart/Coinsprobe (Source: Tradingview)
Like APT, buyers have stepped in to defend this level, resulting in a modest bounce to $4.03, suggesting that the selling pressure may be fading.
The MACD indicator for ATOM is also hinting at a potential bullish crossover. If this pattern continues to play out, ATOM could make another attempt to reclaim the $10.67 neckline resistance in the near term.
A confirmed breakout above this level could trigger a bullish rally toward the $14+ range, offering significant upside potential.
Will This Pattern Spark a Reversal?
Right now, both APT and ATOM are at a critical juncture. Their double bottom formations indicate that as long as they hold their key support levels, there is a strong chance for a bounce. However, a bullish confirmation will only occur if these assets break above their key moving averages (MAs)—indicating a shift in momentum.
Another crucial factor influencing their recovery is Ethereum’s price action. If ETH begins a strong uptrend, it could trigger a broader altcoin rally, reinforcing APT and ATOM’s bullish outlook.
Disclaimer: This article is for informational purposes only and should not be considered financial advice. Always conduct your own research before making any investment decisions.
Disclaimer: The content of this article solely reflects the author's opinion and does not represent the platform in any capacity. This article is not intended to serve as a reference for making investment decisions.
You may also like
Shiba Inu Ecosystem Expands—Team Says Kusama is on Track, SHIB Ready to Pump

Real Estate Meets Crypto— Lumia CEO and Polygon Exec Talk Tokenized $220M Towers

Solana (SOL) Eyes 252% Surge Amid Bullish Signals
Solana (SOL) confirms a Hidden Bull Divergence pattern, signaling a potential 252% surge to $457.97. Is a major breakout ahead?Breaking Key Resistance LevelsCan SOL Reach $457.97?

Retail Bitcoin Holders Are Selling—A Repeat of 2020?
Retail Bitcoin holders are offloading BTC, mirroring the 2020 capitulation phase. What does this mean for the market?Retail Bitcoin Holders Are Selling—What’s Happening?Is This a Bullish or Bearish Signal?What’s Next for Bitcoin?
