Bullish Divergence in Bitcoin: $90K Breakout or Fakeout?

- Bitcoin’s RSI shows bullish divergence, suggesting a potential price rebound if momentum strengthens.
- A breakout above $90,000 could trigger a rally toward $95,000–$100,000, while rejection may lead to another drop to $80,000.
- Despite negative histogram values, a slight positive shift suggests potential upside if buying pressure increases.
The current 12-hour period in Bitcoin price trends shows upward divergence which suggests an upcoming price movement upward. RSI at the top reveals bullish divergence because price established a lower low yet RSI created a higher low pattern. Weak selling momentum combined with recent market data indicates that recovery may happen soon.
RSI indicators now rest above level 50 while confirming bullish proposals. The price trend shows a rounded bottom pattern which provides evidence that a trend reversal is likely to occur. A major resistance tier lies at $90,000 and matches with a previous support zone that evolved into a resistance barrier. Successful recovery of $90,000 would create an opportunity for substantial market expansion.
Bitcoin Nears $90K – Breakout or Pullback?
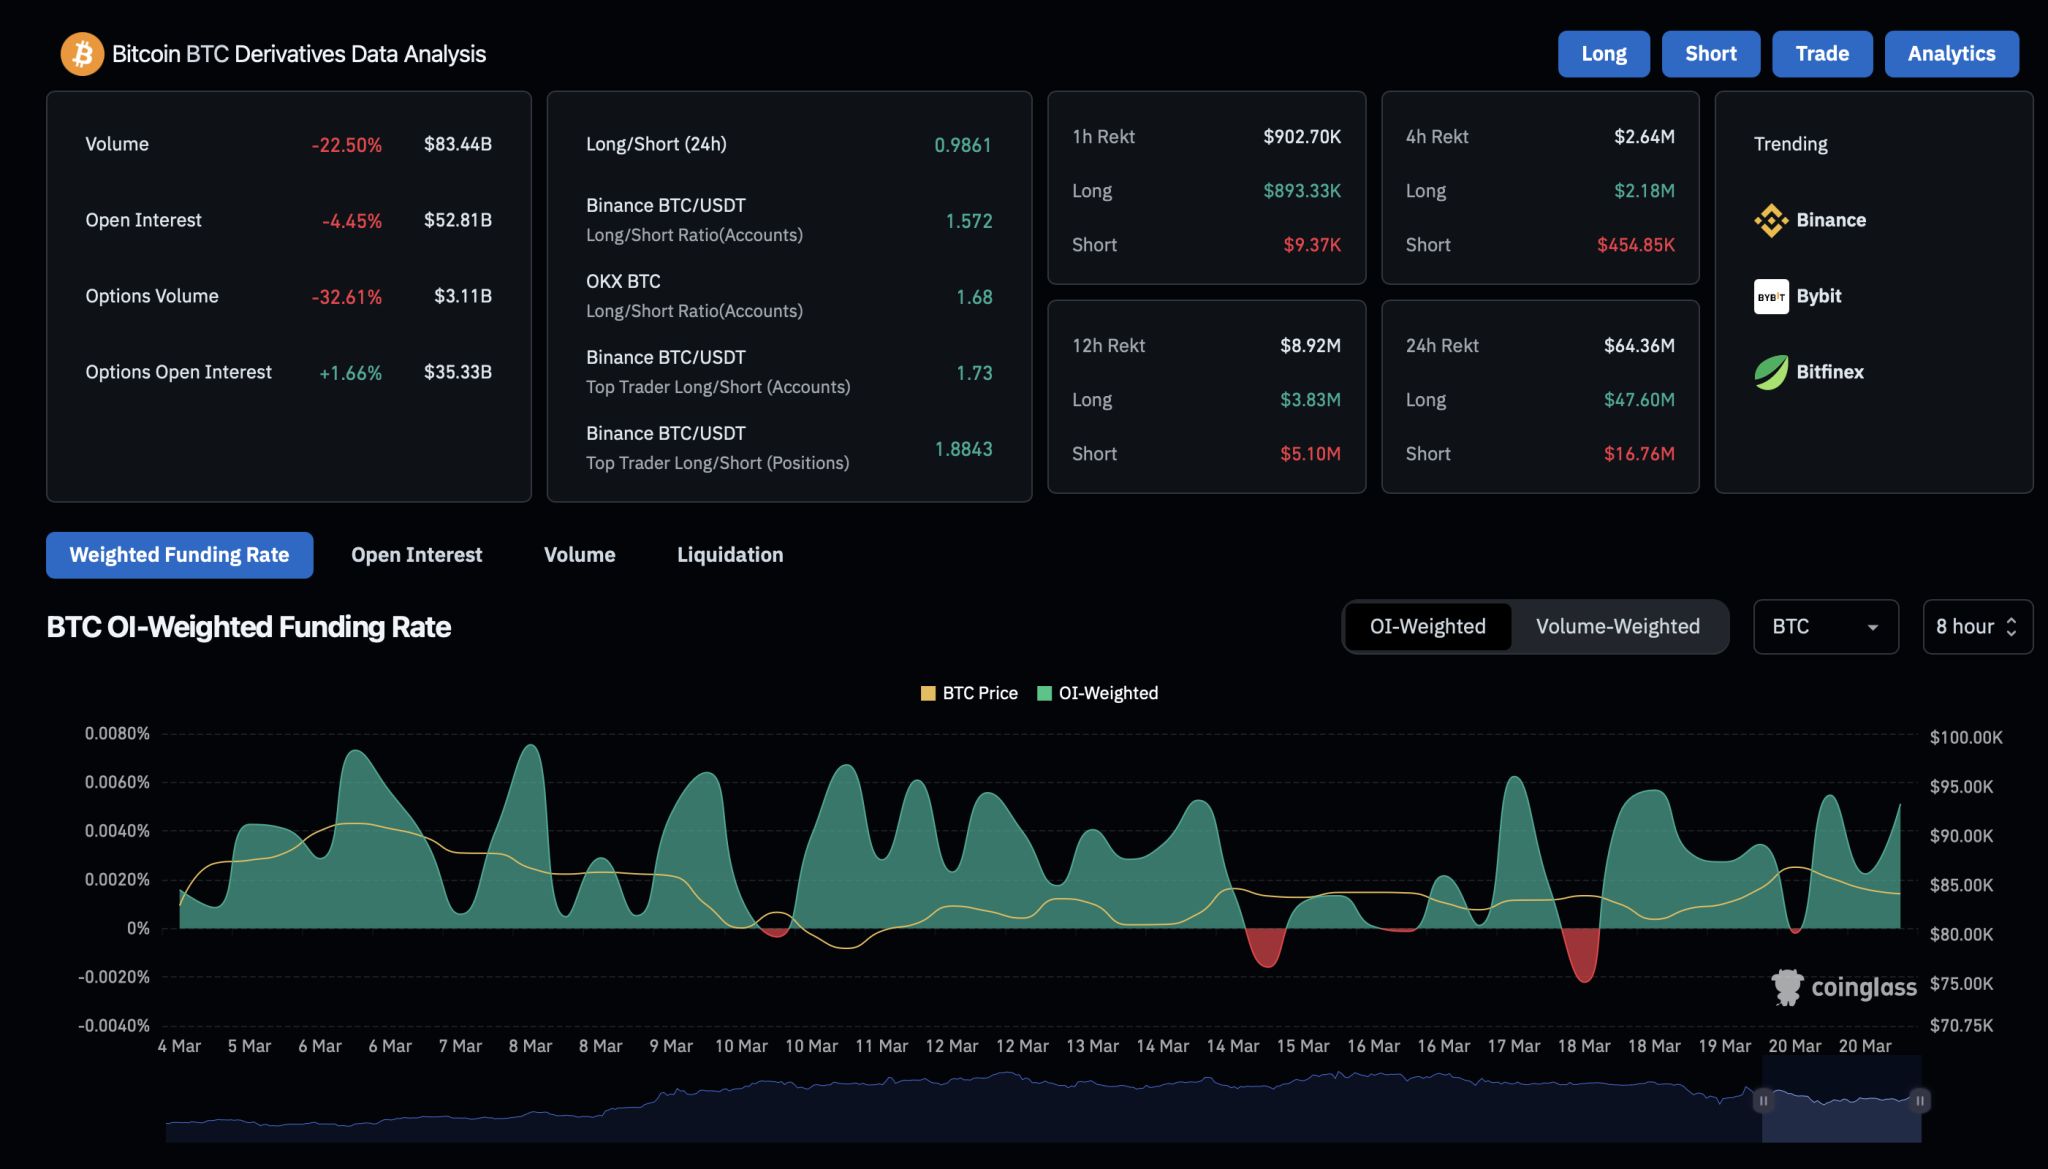
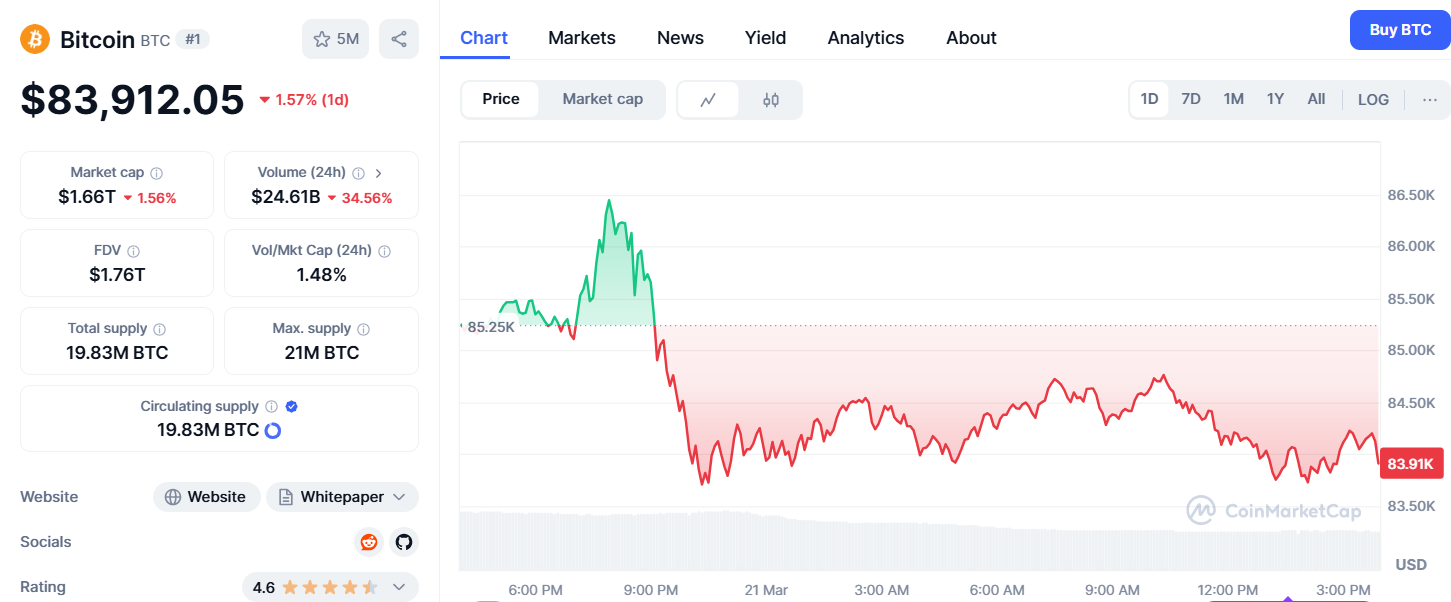
Bitcoin stands at $83,964.36 with its 24-hour price movement spanning from $83,735.87 to $87,431.18. A rejection above $90,000 in Bitcoin would likely spark a steep price rise towards $95,000–$100,000. A break above $80,000–$82,000 support could result in either price consolidation or another analysis of this price zone.
The combination of bullish divergence and rising RSI indicators suggests Bitcoin will recover back to $90,000 before the short term. A confirmed movement would generate potential growth toward $95,000-100,000 over the next few weeks. The price could retreat to $80,000 after rejection at $90,000 before conducting another upward movement.
Bitcoin Consolidates Amid Mixed Technical Indicators
Bitcoin RSI stands at 45.73, this suggests Bitcoin is neither overbought nor oversold, though it has room for potential upside or further decline. The histogram pattern from the MACD framework presents negative values at -2,148.44 and -2,713.04 which reveals downward pressure in the market but a positive value of 564.59 shows potential for a market reversal if buying activity intensifies.
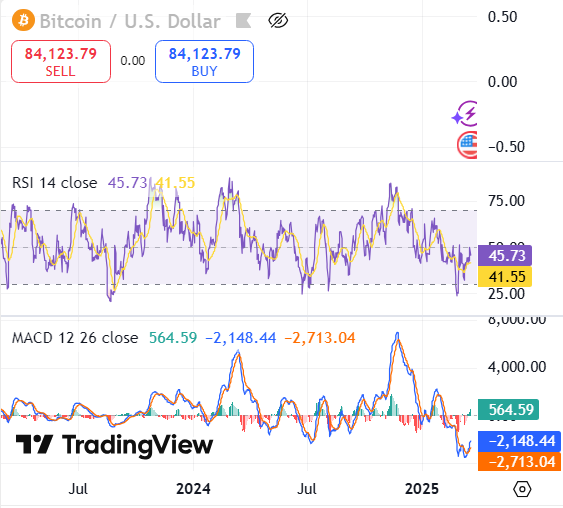 Source: TradingView
The MACD technical indicators show a downward trend which supports future short-term bearish trends until a bullish crossover emerges. Bitcoin continues in its consolidation phase with weak positive signals.
Disclaimer: The content of this article solely reflects the author's opinion and does not represent the platform in any capacity. This article is not intended to serve as a reference for making investment decisions.
You may also like
Crypto Price Today (March 21, 2025): Bitcoin & Altcoins Update; XRP, SOL Drops 4%
TON Bounces from Crucial Support Zone — Will SUI Follow the Same Path?

INJ and KAVA Eye Breakout from Falling Wedge – Reversal on the Horizon?

Bitcoin Breaks Below $85k as Leverage Spikes: Is $80k Next?