Story (IP) Tops Daily Gainers With 5% Surge, Yet Weak Demand Signals Caution
Despite a 5% price surge, Story’s IP faces weak demand and declining volume, raising concerns about the sustainability of its rally and the potential for a price correction.
Story’s IP is today’s top-performing asset. Its price has surged 5% to trade at $$4.37 at press time, defying the broader market’s lackluster performance.
However, despite the price uptick, the weakening demand for the altcoin raises concerns about its rally’s sustainability.
IP Price Rises, But Falling Volume Signals Weak Buying Momentum
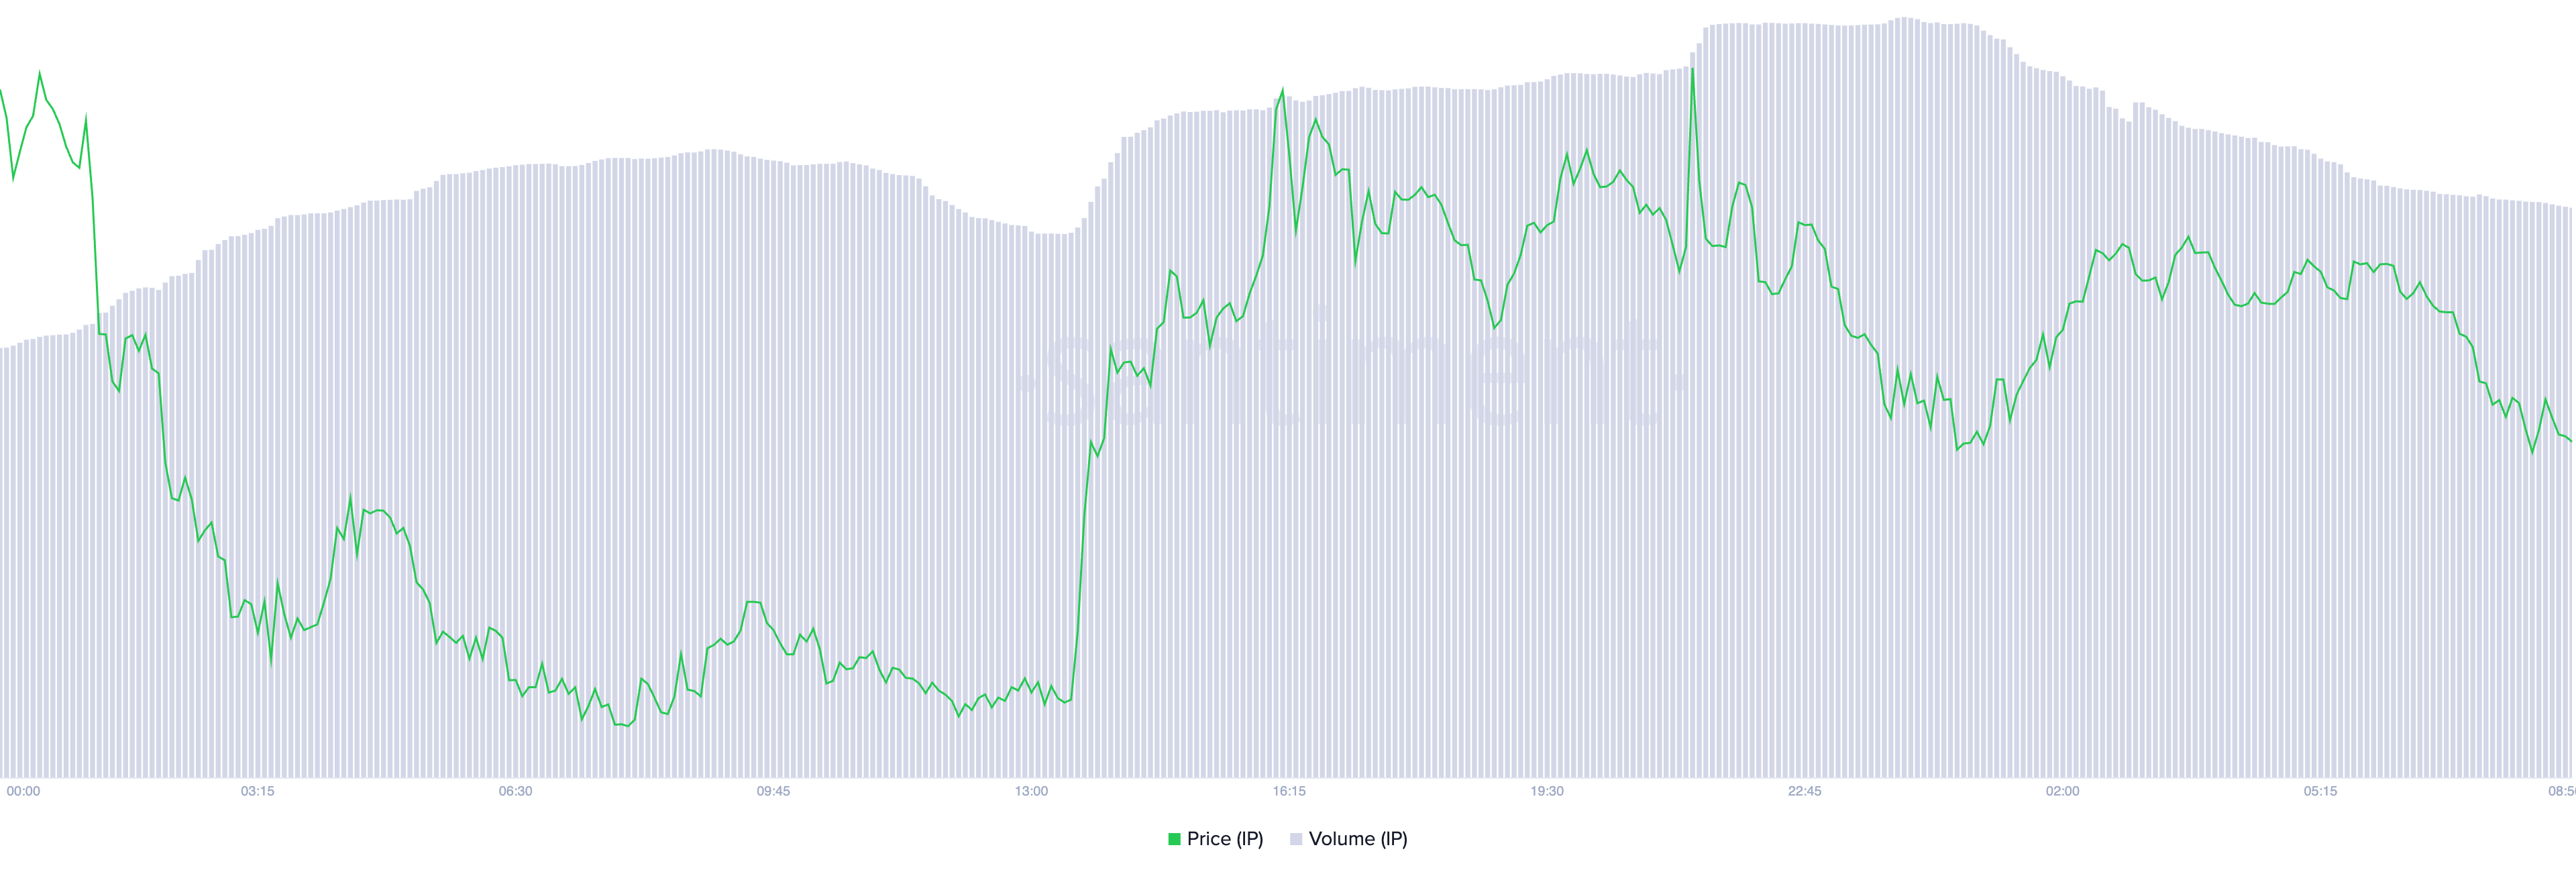
IP’s daily trading volume has plummeted by 7% over the past 24 hours despite the token’s price surge. This forms a negative divergence that hints at the likelihood of a price correction.
 IP Price/Trading Volume. Source:
Santiment
A negative divergence emerges when an asset’s price rises while trading volume falls. It suggests weak buying momentum and a lack of strong market participation.
This indicates that the IP rally may not be sustainable, as fewer traders are backing its upward move. Without sufficient volume to reinforce the price increase, the altcoin is at risk of a potential reversal or correction.
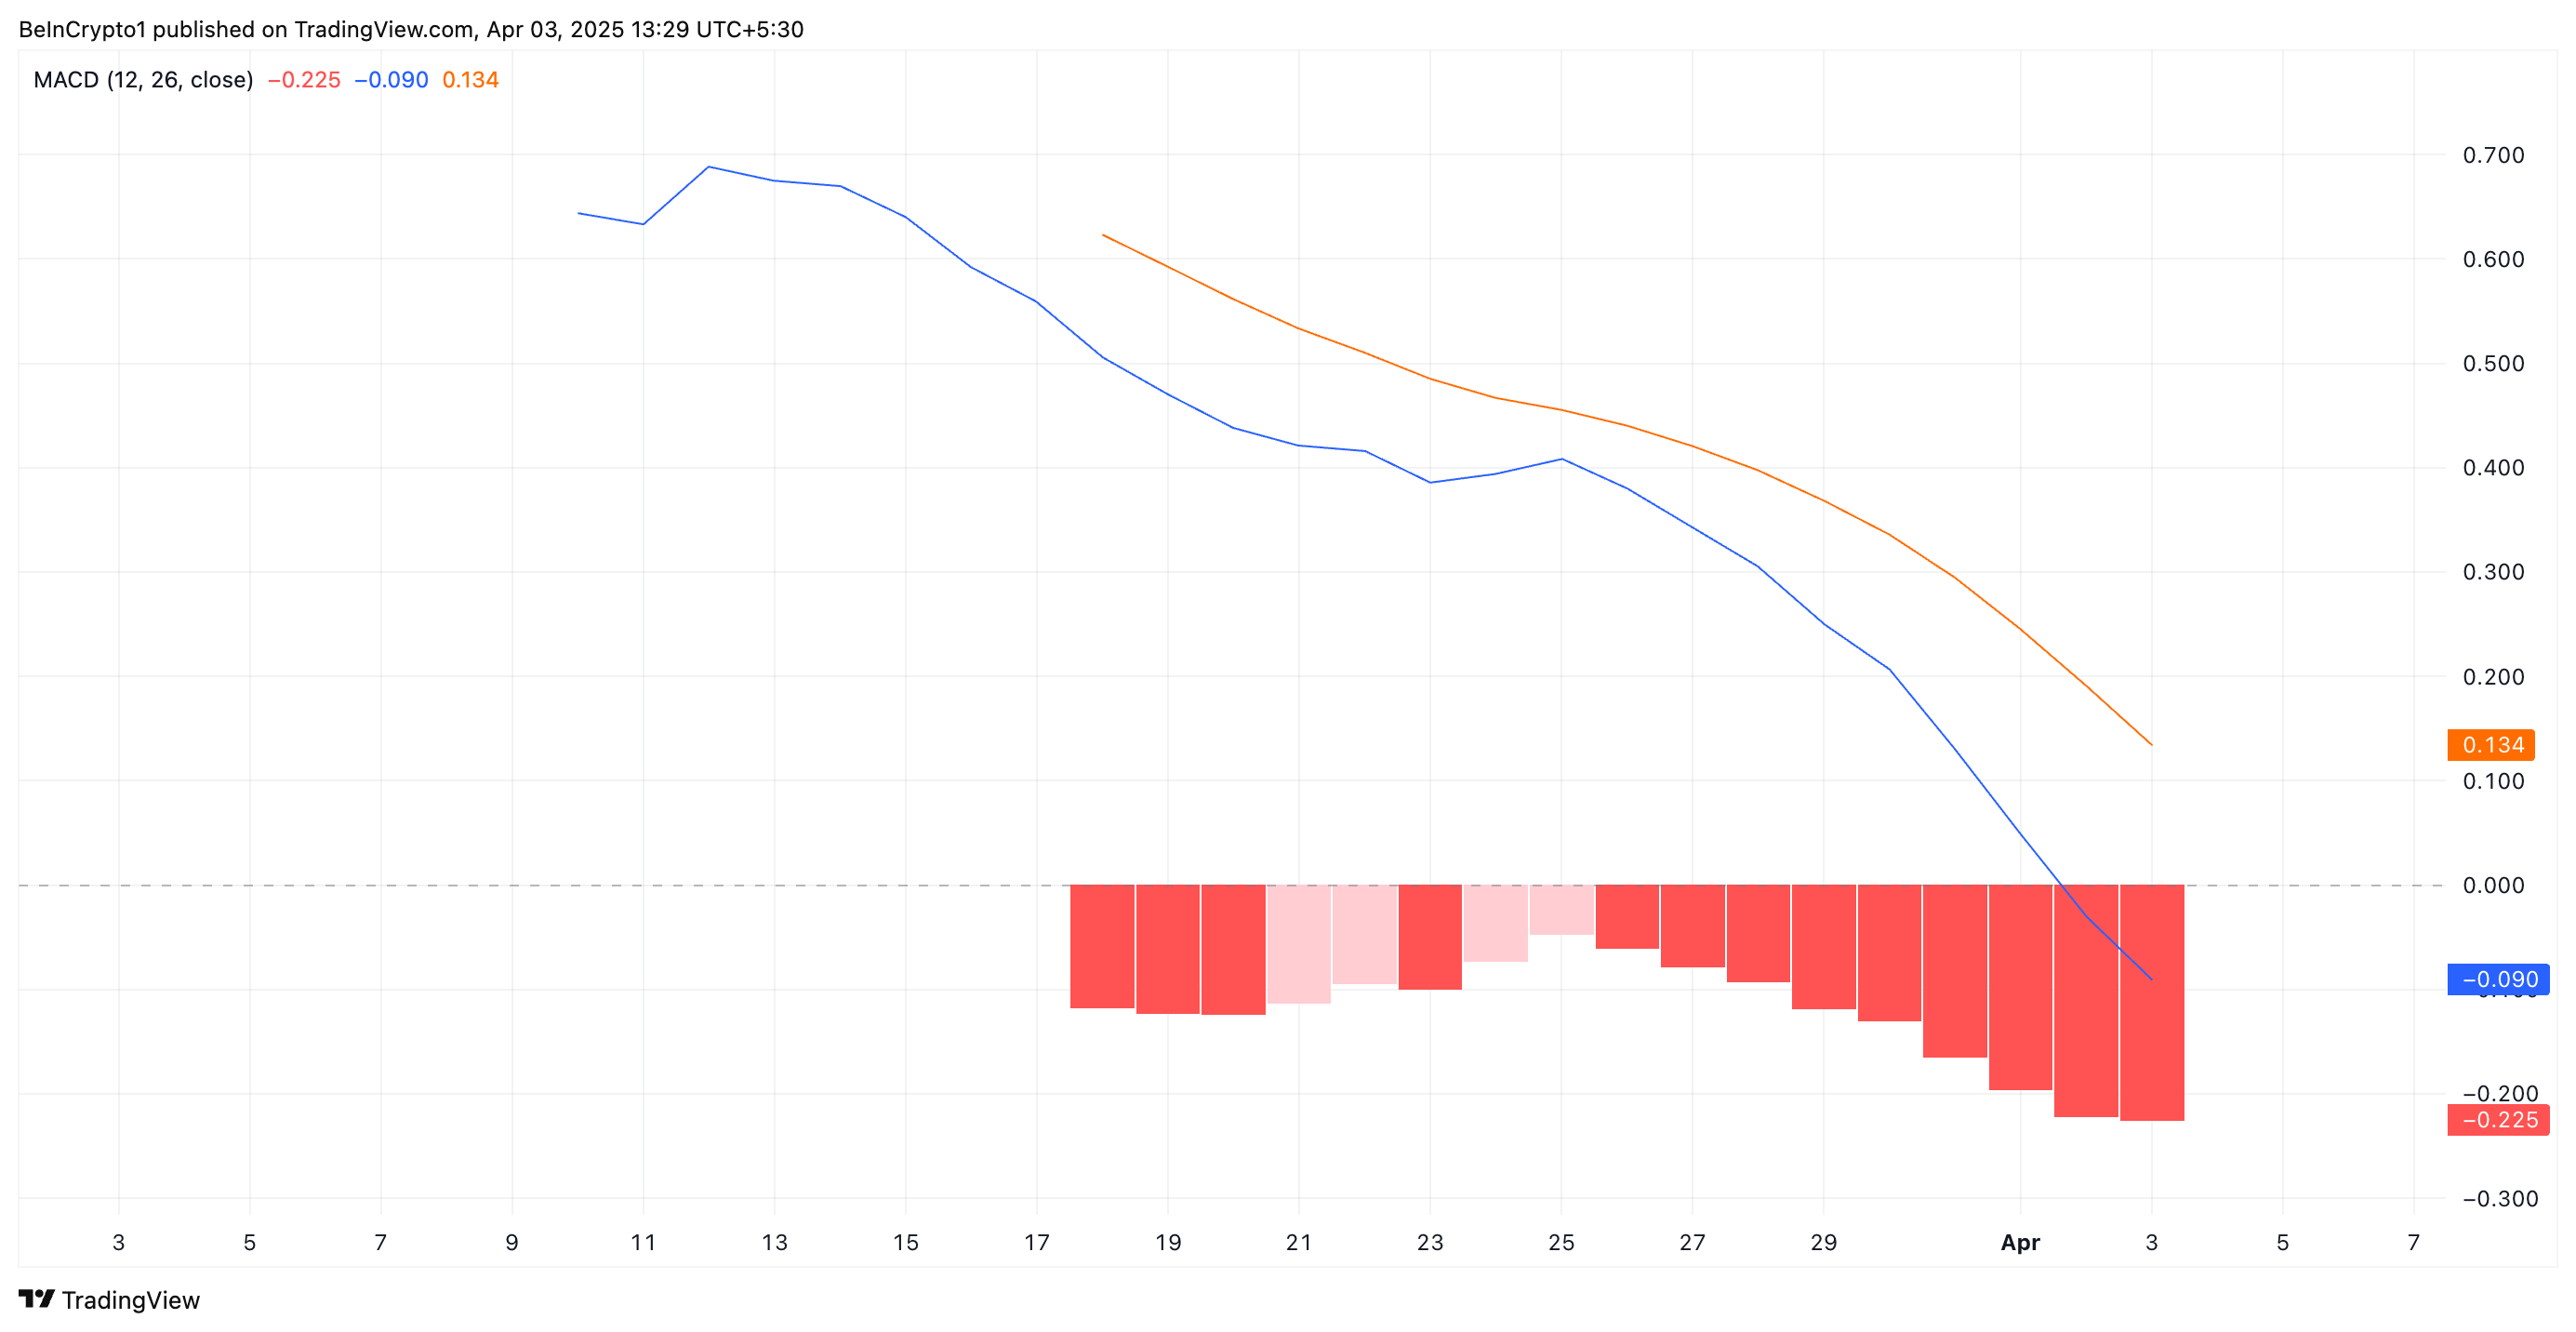
Further, IP’s Moving Average Convergence Divergence (MACD) setup supports this bearish outlook. As of this writing, the token’s MACD line (blue) rests below its signal line (orange), reflecting the selling pressure among IP spot market participants.
 IP MACD. Source:
TradingView
The MACD indicator measures an asset’s trend direction and momentum by comparing two moving averages of an asset’s price. When the MACD line is below the signal line, it indicates bearish momentum, suggesting a potential downtrend or continued selling pressure.
If this trend persists, IP’s recent 5% price surge may lose steam, increasing the likelihood of a short-term correction.
IP’s Bearish Structure Remains Intact – How Low Can It Go?
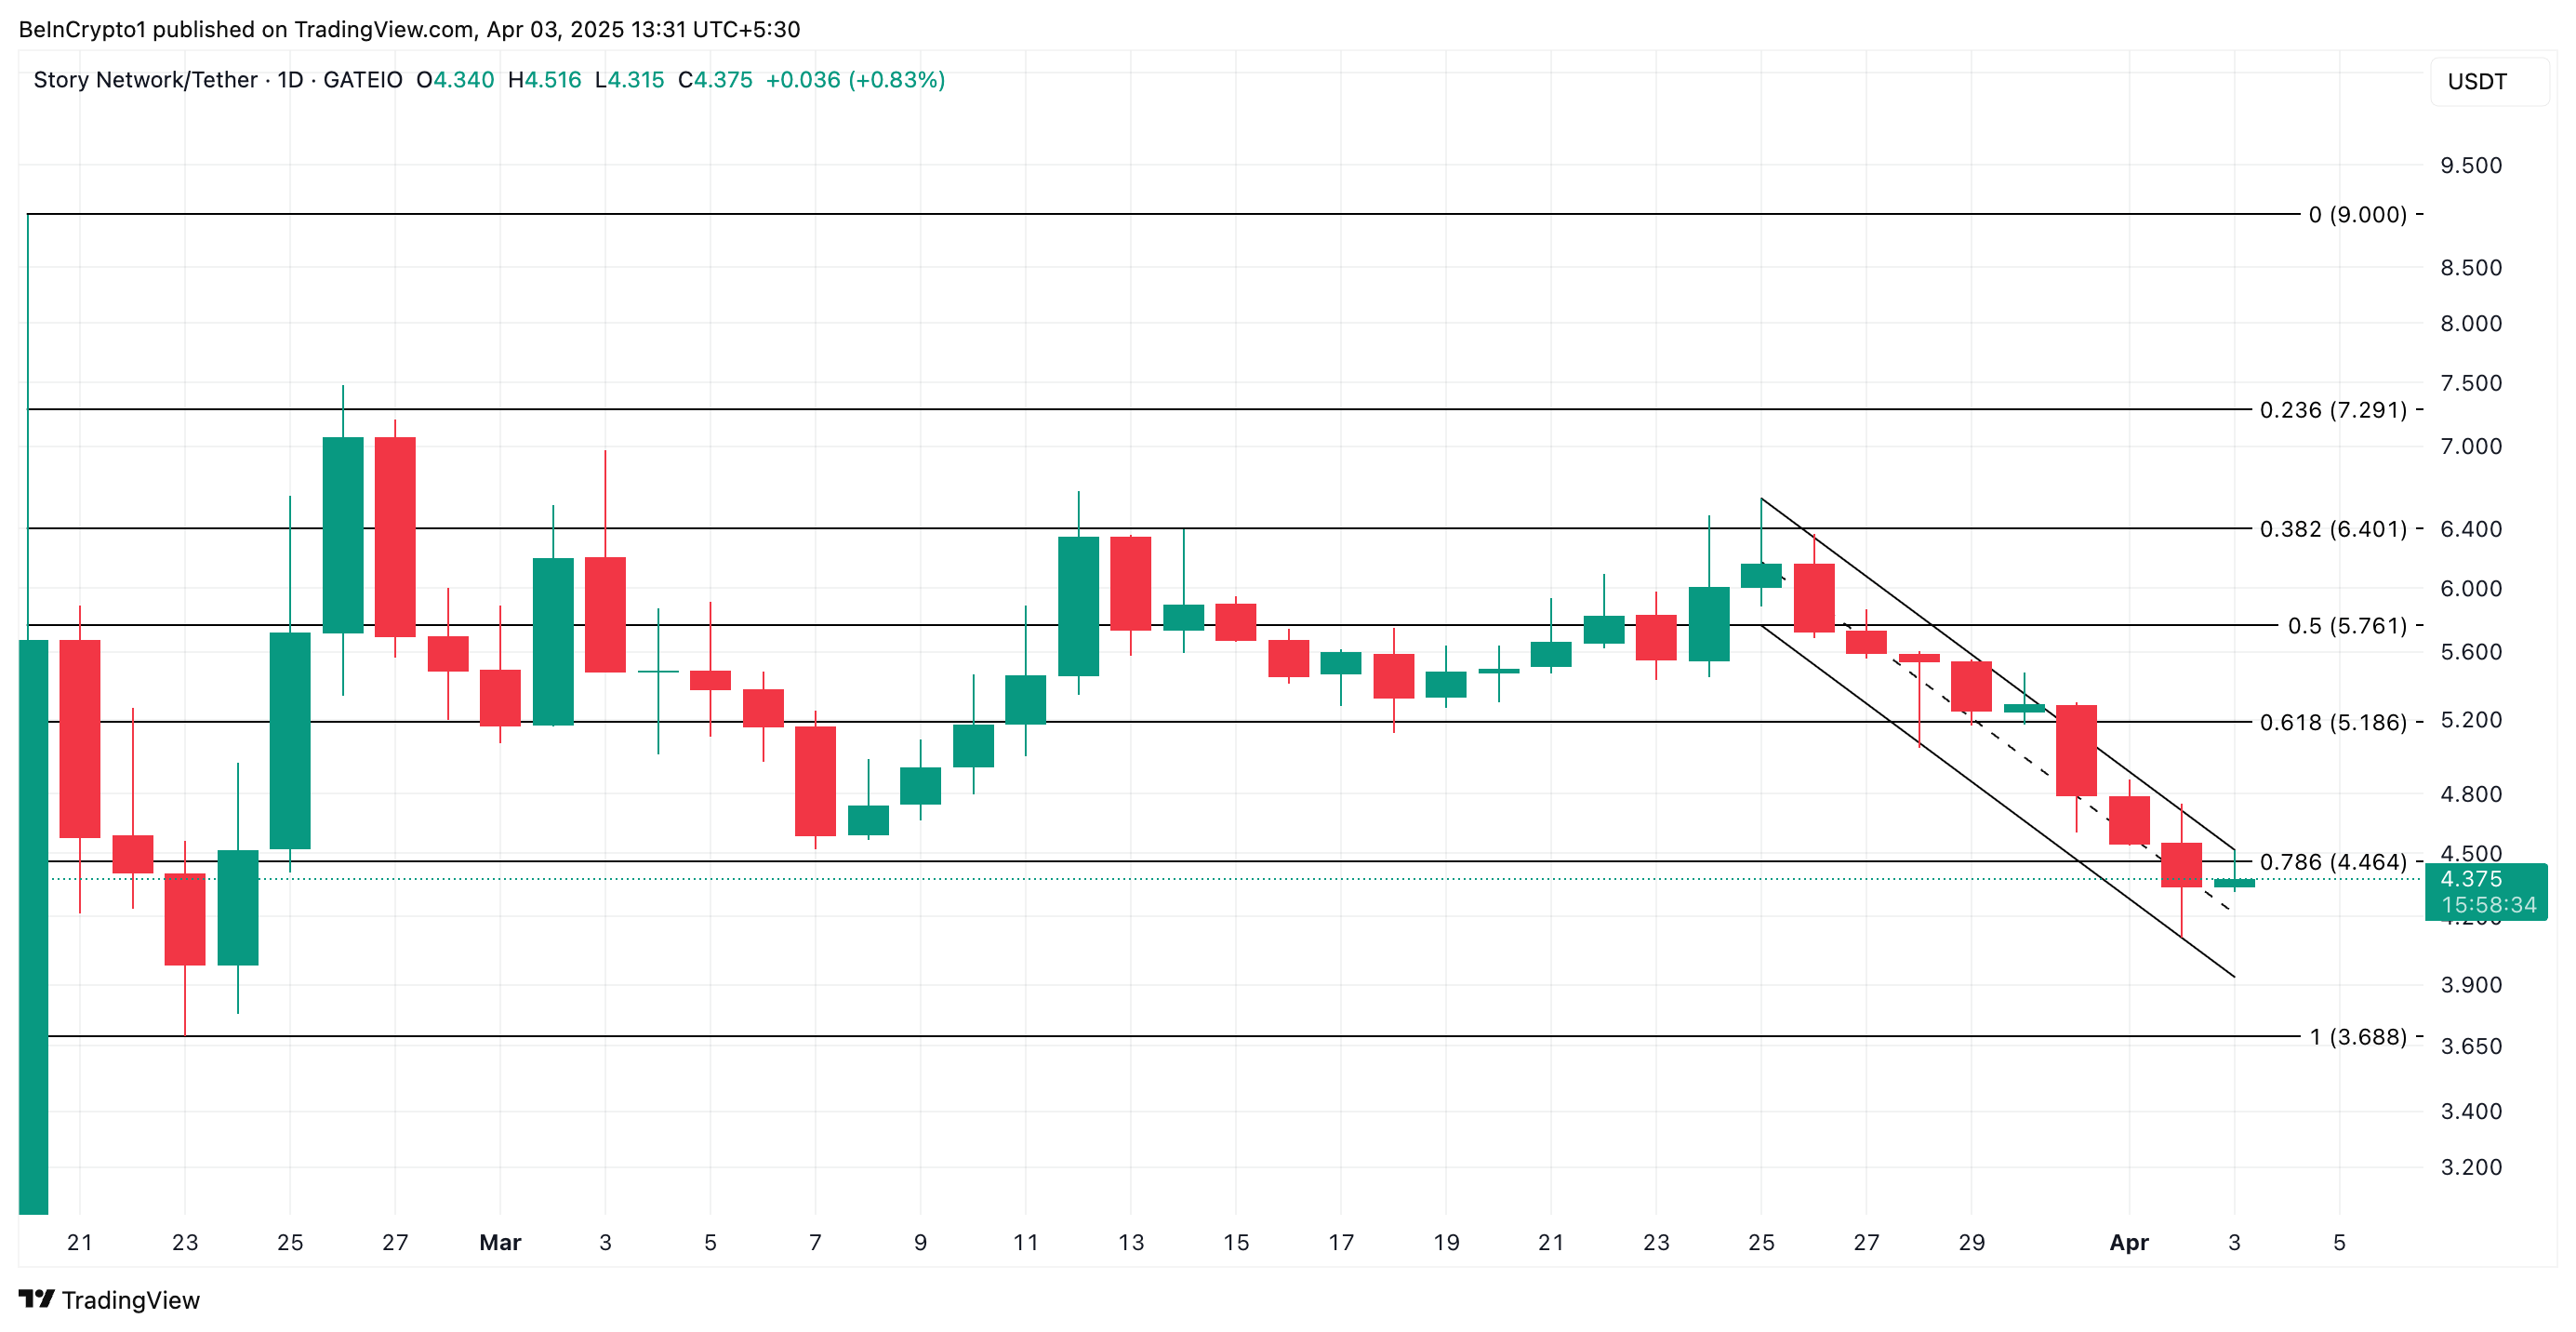
On the daily chart, IP has traded within a descending parallel channel since March 25. This bearish pattern emerges when an asset’s price moves within two downward-sloping parallel trendlines, indicating a consistent pattern of lower highs and lower lows.
This pattern confirm’s IP prevailing downtrend, suggesting continued bearish pressure unless a breakout above resistance occurs.
If the downtrend strengthens, IP’s price could break below the lower trend line of the descending parallel channel and fall to $3.68.
 IP Price Analysis. Source:
TradingView
On the other hand, if the altcoin witnesses a spike in new demand, it could break above the bearish channel and rally toward $5.18.
Disclaimer: The content of this article solely reflects the author's opinion and does not represent the platform in any capacity. This article is not intended to serve as a reference for making investment decisions.
You may also like
Analyst Says “Bitcoin Would Be $150K Now If There Were No Tariff Business”, Shares New Year-End Price Target

Why Does Bitcoin Trade Like a Tech Stock: Experts Weigh In

Is Toncoin ($TON) Set for a Bullish Reversal? Key Updates and Technical Outlook
After a turbulent year marked by legal challenges and market volatility, Toncoin entered 2025 at a critical juncture with growing investor backing and signs of a technical breakout.

Is Ripple Building the Next USDT? RLUSD Stablecoin Quietly Nears $250M
Ripple USD (RLUSD) has silently reached a market cap of nearly $300 million.

