Bitget App
Trade smarter
Buy cryptoMarketsTradeFuturesCopyBotsEarn
RED price

RED priceRED

focusIcon
subscribe
Not listed
Quote currency:
USD
Data is sourced from third-party providers. This page and the information provided do not endorse any specific cryptocurrency. Want to trade listed coins?  Click here

How do you feel about RED today?
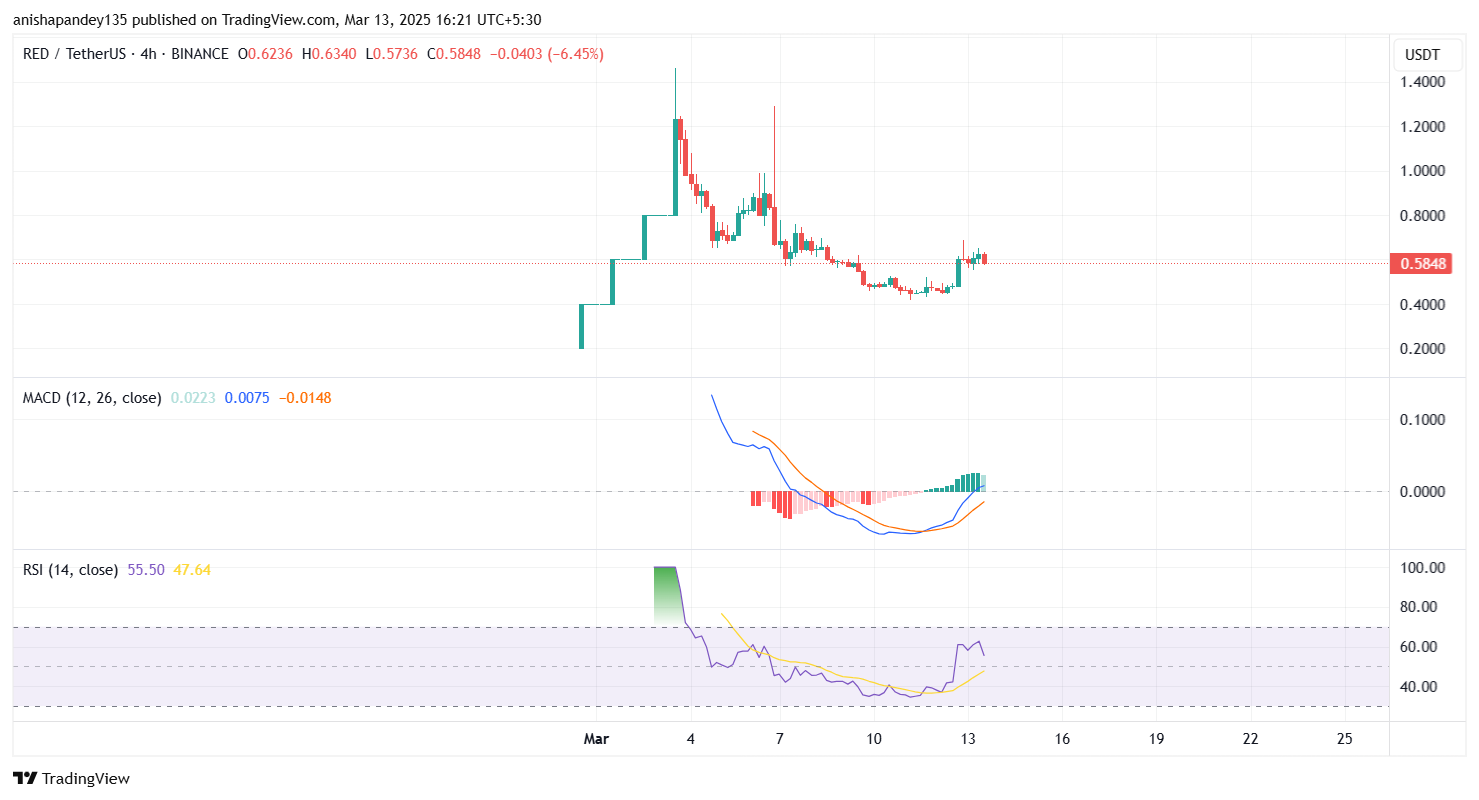
IconGoodGoodIconBadBad
Note: This information is for reference only.

Price of RED today

The live price of RED is $0.001318 per (RED / USD) today with a current market cap of $0.00 USD. The 24-hour trading volume is $0.00 USD. RED to USD price is updated in real time. RED is 0.00% in the last 24 hours. It has a circulating supply of 0 .

What is the highest price of RED?

RED has an all-time high (ATH) of $0.2202, recorded on 2018-05-24.

What is the lowest price of RED?

RED has an all-time low (ATL) of $0.0006996, recorded on 2025-01-29.
Calculate RED profit

RED price prediction

When is a good time to buy RED? Should I buy or sell RED now?

When deciding whether to buy or sell RED, you must first consider your own trading strategy. The trading activity of long-term traders and short-term traders will also be different. The Bitget RED technical analysis can provide you with a reference for trading.
According to the RED 4h technical analysis, the trading signal is Neutral.
According to the RED 1d technical analysis, the trading signal is Buy.
According to the RED 1w technical analysis, the trading signal is Buy.

What will the price of RED be in 2026?

Based on RED's historical price performance prediction model, the price of RED is projected to reach $0.001352 in 2026.

What will the price of RED be in 2031?

In 2031, the RED price is expected to change by +20.00%. By the end of 2031, the RED price is projected to reach $0.003116, with a cumulative ROI of +136.40%.

RED price history (USD)

The price of RED is -30.59% over the last year. The highest price of in USD in the last year was $0.004960 and the lowest price of in USD in the last year was $0.0006996.
TimePrice change (%)Price change (%)Lowest priceThe lowest price of {0} in the corresponding time period.Highest price Highest price
24h+0.00%$0.001318$0.001318
7d+0.00%$0.001318$0.001318
30d+68.11%$0.0006996$0.001639
90d-10.27%$0.0006996$0.001639
1y-30.59%$0.0006996$0.004960
All-time-99.36%$0.0006996(2025-01-29, 44 days ago )$0.2202(2018-05-24, 6 years ago )

RED market information

RED's market cap history

Market cap
--
Fully diluted market cap
$263,656.52
Market rankings
Buy crypto

RED holdings by concentration

Whales
Investors
Retail

RED addresses by time held

Holders
Cruisers
Traders
Live coinInfo.name (12) price chart
loading

RED ratings

Average ratings from the community
4.4
100 ratings
This content is for informational purposes only.

About RED (RED)

Cryptocurrency RED, also known as Reddcoin, has emerged as an innovative digital currency in the cryptocurrency market. With its unique features and growing popularity, RED has gained significant attention from investors and users alike. One key feature of RED is its focus on social media integration. The platform aims to revolutionize the way users engage and interact with social media by allowing them to tip, donate, and reward content creators seamlessly. This feature has the potential to disrupt traditional advertising models and empower individuals with a direct means of supporting their favorite content creators. Another notable aspect of RED is its proof-of-stake velocity (PoSV) algorithm. Unlike traditional proof-of-work systems that require powerful computational resources, RED's PoSV algorithm enables users to earn rewards by simply holding their coins and participating in transactions. This environmentally friendly approach has made RED an attractive option for those concerned about the energy consumption associated with mining cryptocurrencies. Furthermore, RED has a strong focus on user privacy. With a decentralized network and advanced encryption techniques, RED offers users a level of anonymity and security that is highly sought after in the digital era. This feature has made RED an appealing choice for those who value their privacy and want to protect their financial transactions. In terms of historical significance, RED was launched in 2014 and has since gained a dedicated community of supporters. Its longevity in the cryptocurrency market demonstrates the project's resilience and ability to adapt to changing industry trends. Additionally, RED has continually improved its infrastructure and introduced new features to enhance user experience and maintain relevance in the ever-evolving crypto landscape. Overall, cryptocurrency RED has made significant strides in the industry, offering unique features such as social media integration, proof-of-stake velocity, and enhanced privacy. Its historical significance as a pioneering digital currency, combined with its innovative features, positions RED as an intriguing option for both users and investors looking to explore the potential of cryptocurrencies.

RED Social Data

In the last 24 hours, the social media sentiment score for RED was 3, and the social media sentiment towards RED price trend was Bullish. The overall RED social media score was 0, which ranks 639 among all cryptocurrencies.

According to LunarCrush, in the last 24 hours, cryptocurrencies were mentioned on social media a total of 1,058,120 times, with RED being mentioned with a frequency ratio of 0%, ranking 680 among all cryptocurrencies.

In the last 24 hours, there were a total of 58 unique users discussing RED, with a total of RED mentions of 36. However, compared to the previous 24-hour period, the number of unique users increase by 2%, and the total number of mentions has increase by 112%.

On Twitter, there were a total of 0 tweets mentioning RED in the last 24 hours. Among them, 0% are bullish on RED, 0% are bearish on RED, and 100% are neutral on RED.

On Reddit, there were 1 posts mentioning RED in the last 24 hours. Compared to the previous 24-hour period, the number of mentions decrease by 50% .

All social overview

Average sentiment (24h)
3
Social media score (24h)
0(#639)
Social contributors (24h)
58
+2%
Social media mentions (24h)
36(#680)
+112%
Social media dominance (24h)
0%
X
X posts (24h)
0
-100%
X sentiment (24h)
Bullish
0%
Neutral
100%
Bearish
0%
Reddit
Reddit score (24h)
0
Reddit posts (24h)
1
-50%
Reddit comments (24h)
0
0%

RED news

RedStone (RED) Soars 25% with “One Day Five Big Events”

RedStone (RED) has shot up a massive 25% in the past 24 hours amid five major announcements in one day.

Coinspeaker2025-03-12 16:00
Bitget x RED Carnival: Grab a share of 79,500 RED
Bitget Announcement2025-03-07 03:47
New spot margin trading pair — RED/USDT!
Bitget Announcement2025-03-07 03:09
Arrington Capital-Backed RedStone Launches RED Token on Ethereum

The staking model will allow both data providers and token holders to participate in securing the network.

CryptoNews2025-03-07 01:33
More RED updates

New listings on Bitget

New listings

FAQ

What is the current price of RED?

The live price of RED is $0 per (RED/USD) with a current market cap of $0 USD. RED's value undergoes frequent fluctuations due to the continuous 24/7 activity in the crypto market. RED's current price in real-time and its historical data is available on Bitget.

What is the 24 hour trading volume of RED?

Over the last 24 hours, the trading volume of RED is $0.00.

What is the all-time high of RED?

The all-time high of RED is $0.2202. This all-time high is highest price for RED since it was launched.

Can I buy RED on Bitget?

Yes, RED is currently available on Bitget’s centralized exchange. For more detailed instructions, check out our helpful How to buy guide.

Can I get a steady income from investing in RED?

Of course, Bitget provides a strategic trading platform, with intelligent trading bots to automate your trades and earn profits.

Where can I buy RED with the lowest fee?

Bitget offers industry-leading trading fees and depth to ensure profitable investments for traders. You can trade on the Bitget exchange.

Where can I buy crypto?

Buy crypto on the Bitget app
Sign up within minutes to purchase crypto via credit card or bank transfer.
Download Bitget APP on Google PlayDownload Bitget APP on AppStore
Trade on Bitget
Deposit your cryptocurrencies to Bitget and enjoy high liquidity and low trading fees.

Video section — quick verification, quick trading

play cover
How to complete identity verification on Bitget and protect yourself from fraud
1. Log in to your Bitget account.
2. If you're new to Bitget, watch our tutorial on how to create an account.
3. Hover over your profile icon, click on “Unverified”, and hit “Verify”.
4. Choose your issuing country or region and ID type, and follow the instructions.
5. Select “Mobile Verification” or “PC” based on your preference.
6. Enter your details, submit a copy of your ID, and take a selfie.
7. Submit your application, and voila, you've completed identity verification!
Cryptocurrency investments, including buying RED online via Bitget, are subject to market risk. Bitget provides easy and convenient ways for you to buy RED, and we try our best to fully inform our users about each cryptocurrency we offer on the exchange. However, we are not responsible for the results that may arise from your RED purchase. This page and any information included are not an endorsement of any particular cryptocurrency. Any price and other information on this page is collected from the public internet and can not be consider as an offer from Bitget.

Buy

Earn

RED
USD
1 RED = 0.001318 USD
Bitget offers the lowest transaction fees among all major trading platforms. The higher your VIP level, the more favorable the rates.

Bitget Insights

Cryptô•Majnoo
Cryptô•Majnoo
4h
🫣$LAYER Coin Looking 🚀Bullish🚀 Key Observations: 1️⃣-Support Level (Highlighted in Black Box) The price recently broke above a key support/resistance zone around 1.07 USDT. This area was previously resistance but has now turned into support. 2️⃣-Resistance Level (Dashed Red Line) There is a major resistance zone between 1.35 - 1.45 USDT. Historically, the price faced strong rejection from this zone. 3️⃣-Price Movement & Trend The chart shows a cup and handle pattern (curved blue lines). A breakout above 1.07 USDT triggered a bullish move. The price is currently around 1.19 USDT, up by +12.29%. 4️⃣-Indicators & Trend Direction Blue and red arrows indicate buying and selling signals. The price has been forming higher highs and higher lows, signaling an uptrend. Moving averages (red and blue lines) suggest strong bullish momentum. 🧬Conclusion: Bullish Scenario: If the price holds above the 1.07 USDT support, it may continue toward the 1.35 - 1.45 USDT resistance. Bearish Scenario: If the price drops below 1.07 USDT, it could retest 0.97 USDT as support. Trading Strategy: Long Entry: On pullback to 1.07 USDT, with a target around 1.35 USDT. Short Entry: If rejection happens near 1.35 - 1.45 USDT, looking for a drop back to 1.07 USDT.
RED-8.79%
BLUE+9.30%
Cryptoking10
Cryptoking10
5h
MINT Coin: A Deep Dive into Its Market Performance and Potential
The cryptocurrency market is known for its volatility, and $MINT Coin is no exception. As of the latest market update, MINT/USDT is trading at $0.0203, reflecting a 7.73% decline in value for the day. Despite this short-term dip, MINT has shown impressive growth over the past week, with a 306% increase in just seven days. This rapid fluctuation highlights both the risks and opportunities associated with trading MINT Coin. MINT's Market Performance and Mathematical Analysis Key Price Levels and Moving Averages 24h High: $0.0235 24h Low: $0.0198 Moving Averages (MA): MA (5): $0.0214 MA (10): $0.0217 MA (20): $0.0223 Moving Averages are crucial in technical analysis as they help traders determine trends. The fact that the current price ($0.0203) is below all these moving averages suggests a bearish trend in the short term. However, traders often watch for price movements that break above these moving averages as a sign of reversal. Trading Volume and Liquidity 24h Volume: 20.4 million MINT 24h Turnover: $435.1K Recent Candlestick Patterns: The presence of long wicks and fluctuating red and green candles indicates uncertainty in the market. A potential support level at $0.0198, meaning if the price holds here, we could see a rebound. Is MINT a Good Investment? While MINT Coin has experienced a decline today, its weekly performance suggests strong bullish momentum in the broader trend. If the price stabilizes above $0.0214 (MA 5), we might witness a potential uptrend. Investors should watch for key resistance levels around $0.0235, which, if broken, could push the price even higher. Final Thoughts MINT Coin is currently in a critical price range, and traders should analyze both technical and market factors before making decisions. The 7-day surge of 306% indicates strong speculative interest, making it a coin worth monitoring closely.
RED-8.79%
S+4.34%
BitgetPumpsProvider
BitgetPumpsProvider
6h
More Than 300% In 2 Days ❤️ Free Community On Fire $CEC $OMAX $LAI $RED Dogs Zzz Zkf Invite Hive $SOLV $LVVA $UNIO $PI $IP $ALCH $GAME $BIZA $BLZ $FRED $SYLO Spot Trades $SOCIAL $AUCTION $BMT $JAILSTOOL $BANANA $SLT Recover Your Losses daily spot trading
SOCIAL0.00%
RED-8.79%
aizazpak12
aizazpak12
8h
BITCOIN Money Supply, Dollar and Bonds pushing for MEGA RALLY!
This is not the first time we publish a Bitcoin ($BTC USD) analysis in relation to the U.S. Dollar Index (green trend-line) or Chinese Bonds (red trend-line) and Global Liquidity (blue trend-line). In fact we have been doing this since the late 2022 bands in China and like the highly bearish sentiment that was in the market then, we decided to dive into this cross-asset analysis yet again in order to put the current sentiment in perspective. Well it couldn't be more relevant. What we discovered is that all the financial assets mentioned above have yet again aligned to offer the strongest bullish confirmation for BTC since the November 2022 Bear Cycle bottom! More specifically, we are a little past the point where the DXY peaks and declines aggressively, Global Liquidity bottoms and starts rising, while Chinese bonds (our CN02Y/CN20Y ratio) bottom and rise aggressively. In the past 10 years this combination of events has happened 6 times, 2 times during each Cycle: one at the bottom of the Cycle and the other when the final, most aggressive rally starts. Notice also that (naturally) this is where the stock market (SPX, black trend-line) also bottoms and starts rising aggressively. As a result, the above market conditions are an indication that despite the recent monthly correction and turbulence due to a number geopolitical and other trade fundamental reasons, the macro-economic parameters remain intact for the wider picture of this Cycle. Truthfully, this is where an announcement next week of future Fed Rate Cuts would come very handy. So what do you think of this analysis above? Are you fearful that a new Bear Cycle is starting or more confident that the market will soon recover and price a new High? Feel free to let us know in the comments section below!
RED-8.79%
BTC-3.81%
AtiTRADER
AtiTRADER
8h
As of March 13, 2025, the overall price prediction sentiment for Mint Blockchain
As of March 13, 2025, the overall price prediction sentiment for Mint Blockchain is BULLISH, with 13 technical indicators showing bullish signals and 8 indicating bearish signals. The MINT price prediction was last updated on March 13, 2025. Mint Blockchain forecast and prediction overview You may ask questions like: "Should I invest in Mint Blockchain now?", "Should I buy MINT today?", "Will Mint Blockchain be a good or bad investment in short-term, long-term period?". We update Mint Blockchain forecast projection regularly with fresh values. Look at our similar predictions. We making a forecast of future prices for huge amounts of digital coins like Mint Blockchain with technical analysis methods. If you are trying to find cryptocurrencies with good returns, you should explore the maximum of available sources of information about Mint Blockchain in order to make such a responsible decision about the investment by yourself. Mint Blockchain price equal to $0.02085 USD today, but the price can go both up and down and your investment may be lost because cryptocurrency high-risk assets Mint Blockchain Price Prediction Indicators Moving averages are popular tools for Mint Blockchain price prediction. A simple moving average (SMA) calculates the average closing price of MINT over a specific period, like a 12-day SMA. An exponential moving average (EMA) gives more weight to recent prices, reacting faster to price changes. Commonly used moving averages in the crypto market include the 50-day, 100-day, and 200-day averages, which help identify key resistance and support levels. A MINT price move above these averages is seen as bullish, while a drop below indicates weakness. Traders also use RSI and Fibonacci retracement levels to gauge MINT's future direction. How to read Mint Blockchain charts and predict price movements? Most traders prefer candlestick charts over simple line charts because they provide more detailed information. Candlesticks can represent Mint Blockchain's price action in different time frames, such as 5-minute for short-term and weekly for long-term trends. Popular choices include 1-hour, 4-hour, and 1-day charts. A 1-hour candlestick chart, for instance, shows MINT's opening, closing, highest, and lowest prices within each hour. The candle's color is crucial: green indicates the price closed higher than it opened, while red means the opposite. Some charts use hollow and filled candlesticks to convey the same information. What affects the price of Mint Blockchain? Mint Blockchain's price action is driven by supply and demand, influenced by factors like block reward halvings, hard forks, and protocol updates. Real-world events, such as regulations, adoption by companies and governments, and cryptocurrency exchange hacks, also impact MINT's price. Mint Blockchain's market capitalization can change rapidly. Traders often monitor the activity of MINT "whales," large holders of Mint Blockchain, as their actions can significantly influence price movements in the relatively small Mint Blockchain market. $MINT
RED-8.79%
MOVE-7.50%

Related assets

Popular cryptocurrencies
A selection of the top 8 cryptocurrencies by market cap.
Comparable market cap
Among all Bitget assets, these 8 are the closest to RED in market cap.