
Coin bezogen
Preis-Rechner
Preisverlauf
Preisprognose
Technische Analyse
Leitfaden zum Kauf von Coins
Kategorie Krypto
Gewinn-Rechner


Aavegotchi FUD Kurs FUD
Wie denken Sie heute über Aavegotchi FUD?
Preis von Aavegotchi FUD heute
Was ist der höchste Preis von FUD?
Was ist der niedrigste Preis von FUD?
Aavegotchi FUD Preisprognose
Wie hoch wird der Preis von FUD in 2026 sein?
Wie hoch wird der Preis von FUD in 2031 sein?
Aavegotchi FUD Preisverlauf (EUR)
 Niedrigster PreisHöchster Preis
 Aavegotchi FUD Markt-Informationen
Aavegotchi FUD Verlauf der Marktkapitalisierung
Aavegotchi FUD Bestände nach Konzentration
Aavegotchi FUD Adressen nach Haltezeit

Aavegotchi FUD Bewertungen
Über Aavegotchi FUD (FUD)
Aavegotchi FUD Token: Ein umfassender Überblick
Aavegotchi FUD Token ist ein innovatives Produkt im Bereich der Kryptowährungen, das sich in der Branche rasch einen Namen macht. Diese Kryptowährung nutzt die bahnbrechenden Technologien der Blockchain und der Dezentralisierung, um eine einzigartige Benutzererfahrung zu schaffen. Aber was genau macht den Aavegotchi FUD Token so besonders?
Was ist der Aavegotchi FUD Token?
Der Aavegotchi FUD Token ist eine Kryptowährung, die im Aavegotchi-Universum eingeführt wurde. FUD steht für Fear, Uncertainty und Doubt (Angst, Unsicherheit und Zweifel). Das Konzept des FUDs ist in der Kryptowährungsbranche weit verbreitet und bezieht sich auf negative Emotionen oder Aspekte, die möglicherweise den Preis oder die Wahrnehmung einer bestimmten Kryptowährung beeinflussen.
Warum ist der Aavegotchi FUD Token wichtig?
Der Aavegotchi FUD Token hat einige wichtige Eigenschaften, die ihn für Anleger und Nutzer attraktiv machen.
Future Proves Past
Eine der Schlüsselfunktionen des FUD Tokens ist sein Ansatz zur Zukunftssicherung. Dies bedeutet, dass die Eigentümer von FUD Tokens in der Lage sein werden, ihre Tokens in spätere Generationen von Aavegotchis mit erfolgsbasierten Anreizen zu konvertieren. Diese einzigartige Funktion strahlt Stabilität und Vertrauen in die Zukunft des Aavegotchi-Netzwerks aus.
Community-gesteuert
Ein weiterer wichtiger Aspekt des FUD Tokens ist, dass er stark auf die Gemeinschaft ausgerichtet ist. Die Nutzer haben die Möglichkeit, über verschiedene Aspekte des Netzwerks abzustimmen und so an einer demokratischen Selbstverwaltung teilzunehmen. Dies gibt den Nutzern das Gefühl, ein echtes Mitspracherecht in der Zukunft ihres Investments zu haben.
Integration in das Aavegotchi-Universum
Der FUD Token ist vollständig in das Aavegotchi-Universum integriert, was bedeutet, dass er verwendet werden kann, um verschiedene Dinge im Netzwerk zu tun. Darüber hinaus können FUD Tokens auch in anderen Teilen des Aavegotchi-Ökosystems, wie dem Aavegotchi Marktplatz, verwendet werden.
Zusammenfassung
Der Aavegotchi FUD Token ist mehr als nur ein weiterer Token auf dem Markt. Mit seiner einzigartigen Mischung aus Community-Einbindung, Zukunftssicherheit und Integration in das umfassendere Aavegotchi-Universum stellt er einen spannenden Schritt in der Welt der Kryptowährungen dar.
Ob Sie ein erfahrener Krypto-Investor oder ein Neuling in der Welt der digitalen Währungen sind, es ist sicherlich lohnenswert, den Aavegotchi FUD Token im Auge zu behalten. Mit seiner starken Community und seinen innovativen Funktionen könnte er die Art und Weise verändern, wie wir Kryptowährungen sehen und nutzen.
FUD in lokaler Währung
- 1
- 2
- 3
- 4
- 5
Aavegotchi FUD Nachrichten

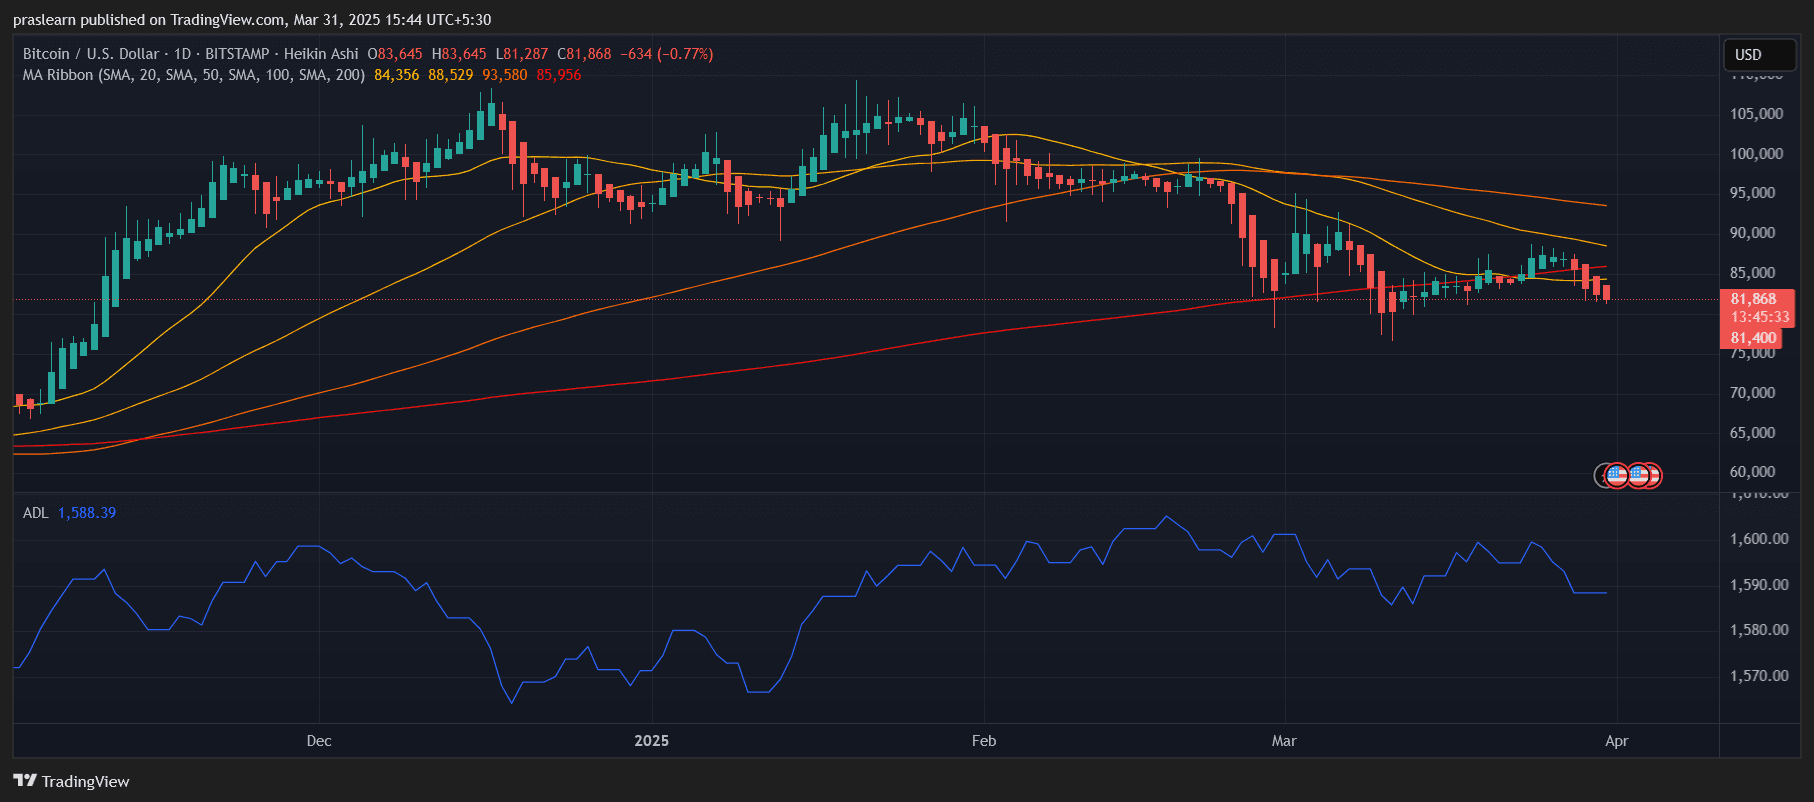
Der Bitcoin Kurs ist unter wichtige gleitende Durchschnitte gefallen, was bei Händlern und Investoren neue Bedenken auslöst.

Neue Listings auf Bitget

Mehr kaufen


FAQ
Wie hoch ist der aktuelle Preis von Aavegotchi FUD?
Wie hoch ist das 24-Stunden-Trading-Volumen von Aavegotchi FUD?
Was ist das Allzeithoch von Aavegotchi FUD?
Kann ich Aavegotchi FUD auf Bitget kaufen?
Kann ich mit Investitionen in Aavegotchi FUD ein regelmäßiges Einkommen erzielen?
Wo kann ich Aavegotchi FUD mit der niedrigsten Gebühr kaufen?
Wo kann ich Krypto kaufen?
Videobereich - schnelle Verifizierung, schnelles Trading

Bitget Insights


Verwandte Assets


