Kaspa (KAS) is stealing the spotlight in March 2025, dominating altcoin conversations with its innovative tech and whispers of a Binance listing. As crypto enthusiasts buzz about its potential, this technical analysis unpacks KAS price action, prediction, key support and resistance levels, and emerging chart patterns.
Whether you’re a trader or investor, discover what’s fueling Kaspa’s momentum and where it might head next in this dynamic altcoin season.
B2B! 🔋
In the past two days, #Kaspa has been THE most mentioned Altcoin on X, according to @Altcoin_Scan . 🎉
— Saint (@saint1v) March 19, 2025
Without further ado, let’s dig into our Technical Analysis!
DISCOVER: Best Meme Coin ICOs to Invest in March 2025
Decoding Kaspa’s Price Action – Kaspa Technical Analysis
( KASUSDT )
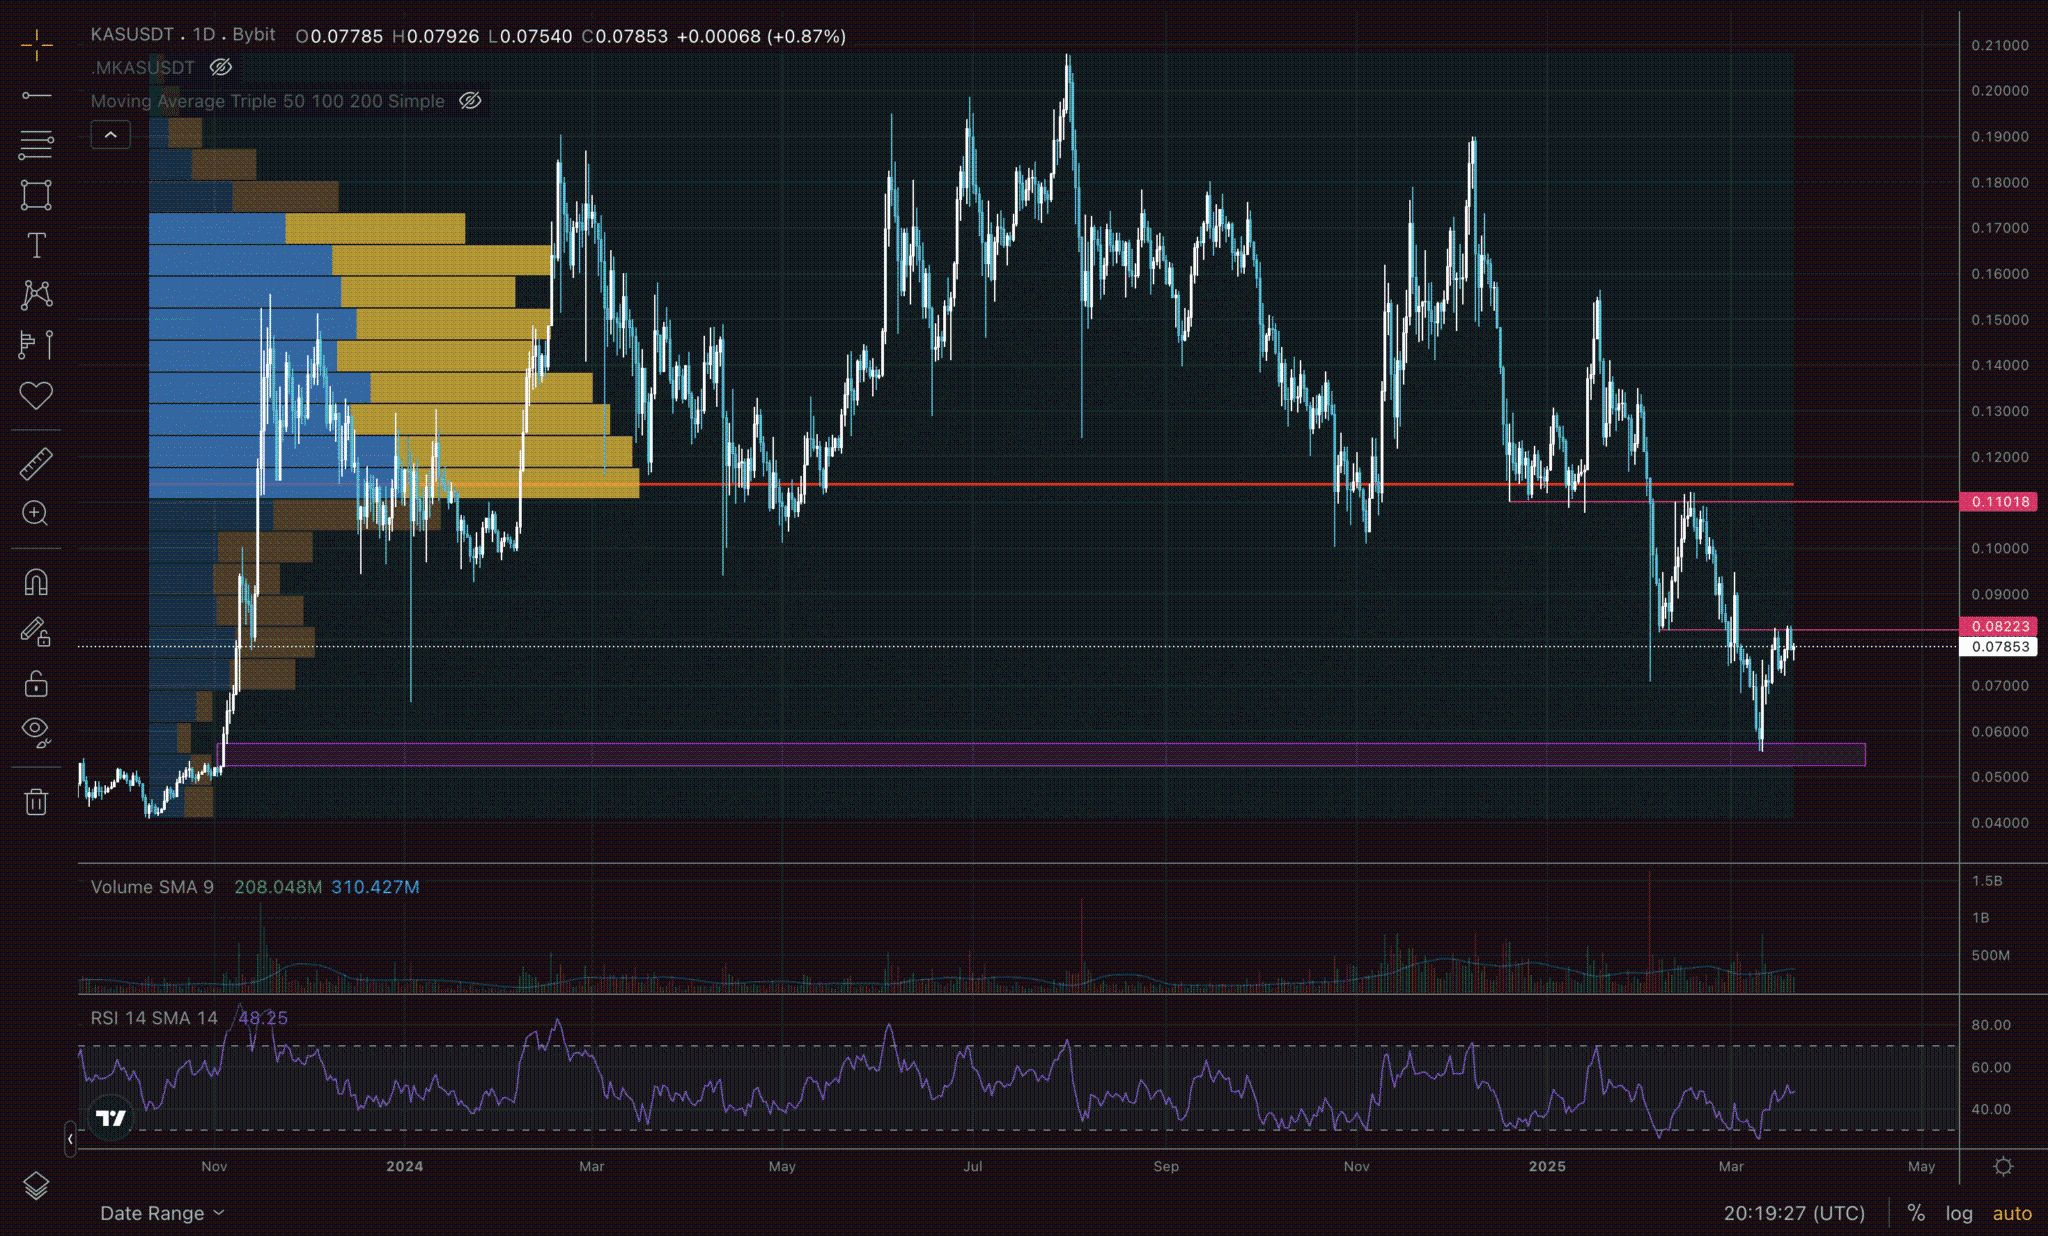
We are first looking at the higher timeframe – 1D – to get as much context as possible. In exploring the chart patterns, I’ve identified a few key areas where different tools were used. Starting with the lowest and slowly moving up. The purple box is the Daily FVG gap dating back to the pre-historic year of 2023. Who would’ve thought it would get filled eventually?! Well, it did, and the price bounced off 46%!
Next, we have the 0.082 level, which is the last low and current resistance we are testing. A bit higher than that we have the 0.11 level, which was broken below in early February and tested a few times before price descending to make another low (at our FVG gap). Pure down trend price action. Break below support, bounce and test it for resistance. Repeat.
Last on the first chart is FVRP graph, giving us a PoC at a little above the 0.11 resistance. This makes me consider it a target, once price breaks above current resistance.
Chart Patterns and Breakout Signals to Watch
( KASUSDT )
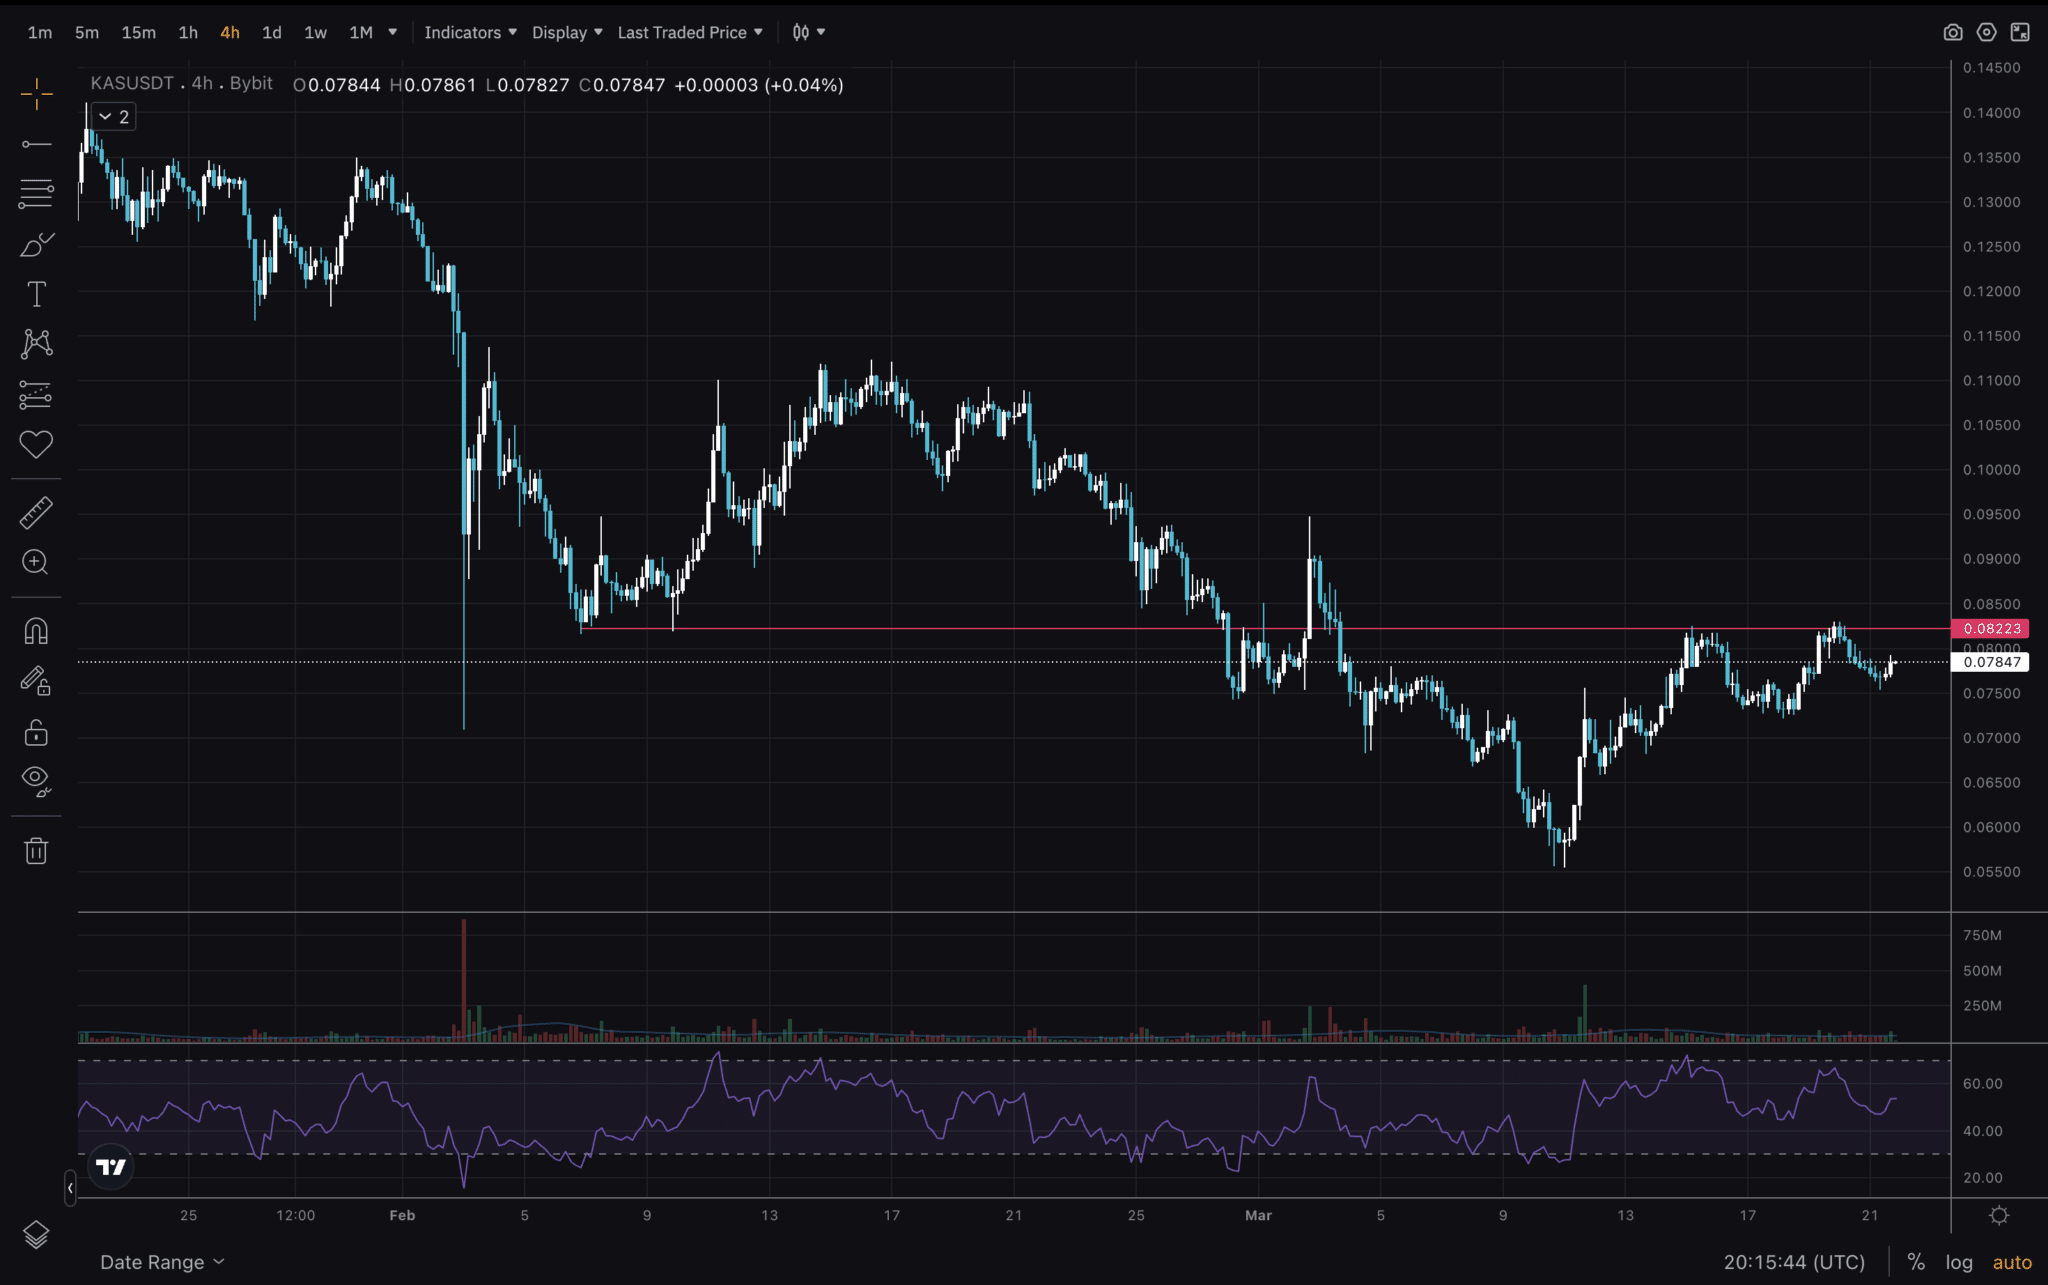
Next timeframe is somewhat average – 4H. Not too high, but also not too low. Great for intra-day swing trades. Clear sight of the. resistance level. If we trace it, we will see one test on the 1st of March. Then a fake breakout / fakeout on March 2-3rd. And two more tests during this week. The more a level gets tested, the more likely it is to give in.
DISCOVER: 20+ Next Crypto to Explode in 2025
( KASUSDT )
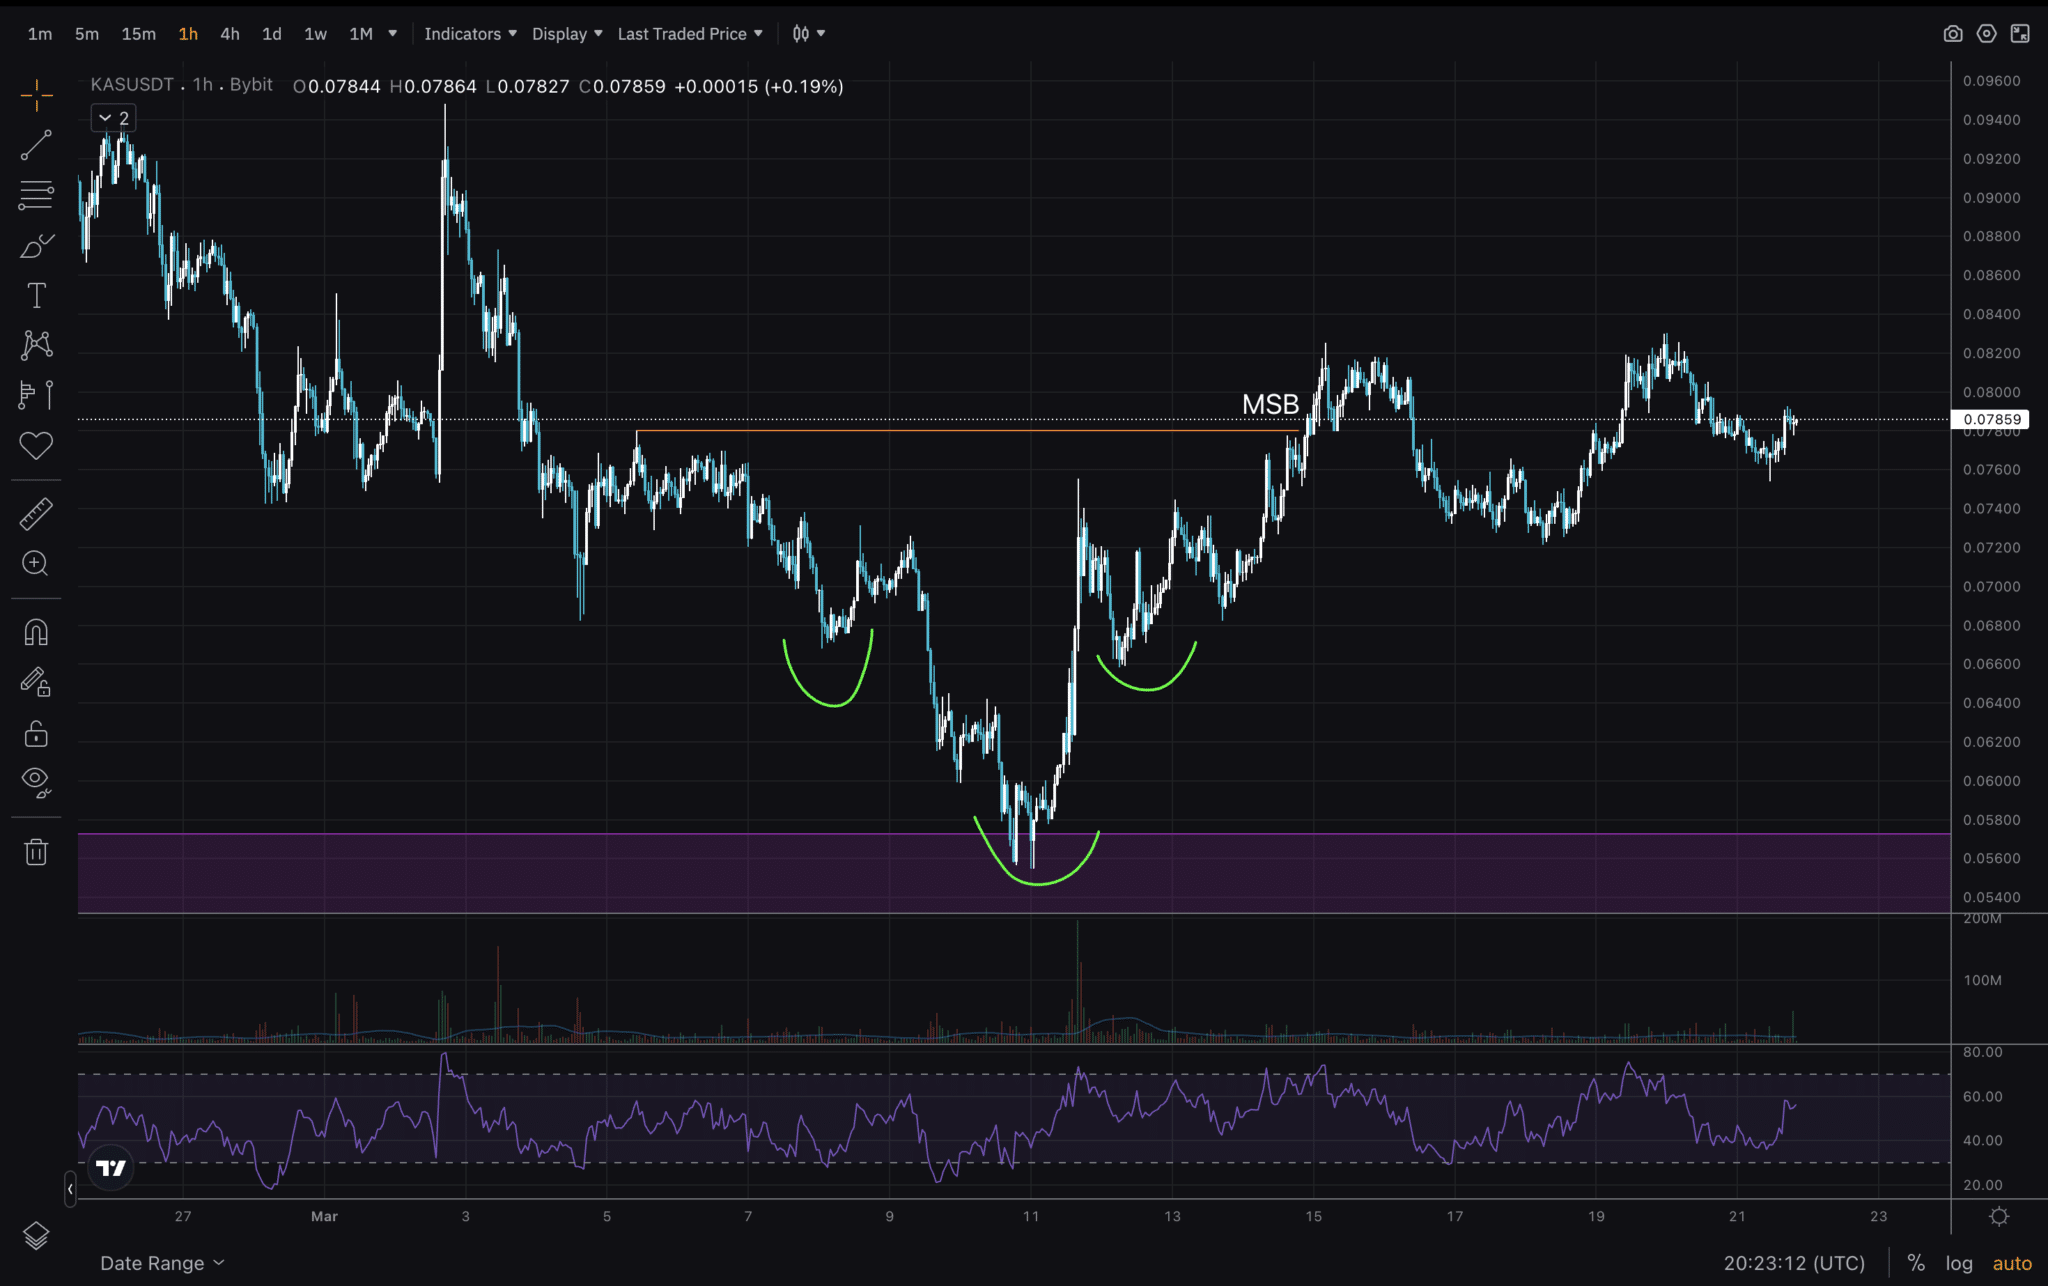
Lastly, it is 1 hour, which is a low timeframe. Though not for scalping! Here we see Kaspa chart patterns that coincide with other occurring altcoin market trends. In other words, we see price movements that occur in many other charts. One of these patterns is the head and shoulders (in green), often indicating price reversal. The higher the timeframe, the bigger the chances. We also see an MSB – again, it’s in the low timeframe, but it’s a great start to looking for cryptocurrency breakout signals.
In conclusion, for the upcoming days, my KAS price prediction/expectation is to see a break of $0.082 and then continue to $0.11. A listing on Binance could be the needed catalyst.
DISCOVER: Best Meme Coin ICOs to Invest in March 2025
Join The 99Bitcoins News Discord Here For The Latest Market Updates
Kaspa - KAS Technical Analysis and Price Prediction
- KAS tested the FVG Daily level from late 2023.
- Key levels to watch as altcoin market trends look bullish.
- Rumour of Binance listing – if true, can send the price up.
- Early bullish signs on 1H.