Bitget:全球日交易量排名前 4!
BTC 市占率61.01%
Bitget 新幣上架 : Pi Network
BTC/USDT$83704.36 (-4.07%)恐懼與貪婪指數44(恐懼)
山寨季指數:0(比特幣季)
盤前交易幣種PAWS,WCT比特幣現貨 ETF 總淨流量:+$89M(1 天);+$550.2M(7 天)。Bitget 新用戶立享 6,200 USDT 歡迎禮包!立即領取
到 Bitget App 隨時隨地輕鬆交易!立即下載
Bitget:全球日交易量排名前 4!
BTC 市占率61.01%
Bitget 新幣上架 : Pi Network
BTC/USDT$83704.36 (-4.07%)恐懼與貪婪指數44(恐懼)
山寨季指數:0(比特幣季)
盤前交易幣種PAWS,WCT比特幣現貨 ETF 總淨流量:+$89M(1 天);+$550.2M(7 天)。Bitget 新用戶立享 6,200 USDT 歡迎禮包!立即領取
到 Bitget App 隨時隨地輕鬆交易!立即下載
Bitget:全球日交易量排名前 4!
BTC 市占率61.01%
Bitget 新幣上架 : Pi Network
BTC/USDT$83704.36 (-4.07%)恐懼與貪婪指數44(恐懼)
山寨季指數:0(比特幣季)
盤前交易幣種PAWS,WCT比特幣現貨 ETF 總淨流量:+$89M(1 天);+$550.2M(7 天)。Bitget 新用戶立享 6,200 USDT 歡迎禮包!立即領取
到 Bitget App 隨時隨地輕鬆交易!立即下載


Fuel Network 價格FUEL
上架
報價幣種:
TWD
NT$0.3543-9.88%1D
價格走勢圖
TradingView
最近更新時間 2025-03-28 19:45:54(UTC+0)
市值:NT$1,568,155,439.23
完全稀釋市值:NT$1,568,155,439.23
24 小時交易額:NT$94,579,552.49
24 小時交易額/市值:6.03%
24 小時最高價:NT$0.3891
24 小時最低價:NT$0.3534
歷史最高價:NT$2.8
歷史最低價:NT$0.3305
流通量:4,425,621,000 FUEL
總發行量:
10,066,365,522.19FUEL
流通率:43.00%
最大發行量:
--FUEL
以 BTC 計價:0.{6}1276 BTC
以 ETH 計價:0.{5}5690 ETH
以 BTC 市值計價:
NT$12,448.8
以 ETH 市值計價:
NT$1,697.73
合約:
0x675B...192079c(Ethereum)
更多
您今天對 Fuel Network 感覺如何?
注意:此資訊僅供參考。
Fuel Network 今日價格
Fuel Network 的即時價格是今天每 (FUEL / TWD) NT$0.3543,目前市值為 NT$1.57B TWD。24 小時交易量為 NT$94.58M TWD。FUEL 至 TWD 的價格為即時更新。Fuel Network 在過去 24 小時內的變化為 -9.88%。其流通供應量為 4,425,621,000 。
FUEL 的最高價格是多少?
FUEL 的歷史最高價(ATH)為 NT$2.8,於 2024-12-29 錄得。
FUEL 的最低價格是多少?
FUEL 的歷史最低價(ATL)為 NT$0.3305,於 2025-03-13 錄得。
Fuel Network 價格預測
FUEL 在 2026 的價格是多少?
根據 FUEL 的歷史價格表現預測模型,預計 FUEL 的價格將在 2026 達到 NT$0.5351。
FUEL 在 2031 的價格是多少?
2031,FUEL 的價格預計將上漲 +46.00%。 到 2031 底,預計 FUEL 的價格將達到 NT$1.28,累計投資報酬率為 +221.70%。
Fuel Network 價格歷史(TWD)
過去一年,Fuel Network 價格上漲了 -78.53%。在此期間,FUEL 兌 TWD 的最高價格為 NT$2.8,FUEL 兌 TWD 的最低價格為 NT$0.3305。
時間漲跌幅(%) 最低價最高價
最低價最高價 24h-9.88%NT$0.3534NT$0.3891
7d-31.57%NT$0.3534NT$0.5705
30d+1.19%NT$0.3305NT$0.5705
90d-86.26%NT$0.3305NT$2.8
1y-78.53%NT$0.3305NT$2.8
全部時間-46.59%NT$0.3305(2025-03-13, 16 天前 )NT$2.8(2024-12-29, 90 天前 )
Fuel Network 市場資訊
Fuel Network 行情
Fuel Network 持幣
Fuel Network 持幣分布矩陣
Fuel Network 持幣分布集中度
巨鯨
投資者
散戶
Fuel Network 地址持有時長分布
長期持幣者
游資
交易者
coinInfo.name(12)即時價格表

Fuel Network 評級
社群的平均評分
4.3
此內容僅供參考。
FUEL 兌換當地法幣匯率表
1 FUEL 兌換 MXN$0.221 FUEL 兌換 GTQQ0.081 FUEL 兌換 CLP$10.051 FUEL 兌換 UGXSh39.111 FUEL 兌換 HNLL0.271 FUEL 兌換 ZARR0.21 FUEL 兌換 TNDد.ت0.031 FUEL 兌換 IQDع.د13.991 FUEL 兌換 TWDNT$0.351 FUEL 兌換 RSDдин.1.161 FUEL 兌換 DOP$0.681 FUEL 兌換 MYRRM0.051 FUEL 兌換 GEL₾0.031 FUEL 兌換 UYU$0.451 FUEL 兌換 MADد.م.0.11 FUEL 兌換 AZN₼0.021 FUEL 兌換 OMRر.ع.01 FUEL 兌換 SEKkr0.111 FUEL 兌換 KESSh1.381 FUEL 兌換 UAH₴0.44
- 1
- 2
- 3
- 4
- 5
最近更新時間 2025-03-28 19:45:54(UTC+0)
如何購買 Fuel Network(FUEL)

建立您的免費 Bitget 帳戶
使用您的電子郵件地址/手機號碼在 Bitget 註冊,並建立強大的密碼以確保您的帳戶安全

認證您的帳戶
輸入您的個人資訊並上傳有效的身份照片進行身份認證

將 Fuel Network 兌換為 FUEL
我們將為您示範使用多種支付方式在 Bitget 上購買 Fuel Network
了解更多交易 FUEL 永續合約
在 Bitget 上註冊並購買 USDT 或 FUEL 後,您可以開始交易衍生品,包括 FUEL 合約和槓桿交易,增加收益。
FUEL 的目前價格為 NT$0.3543,24 小時價格變化為 -9.88%。交易者可透過做多或做空 FUEL 合約獲利。
Fuel Network 動態
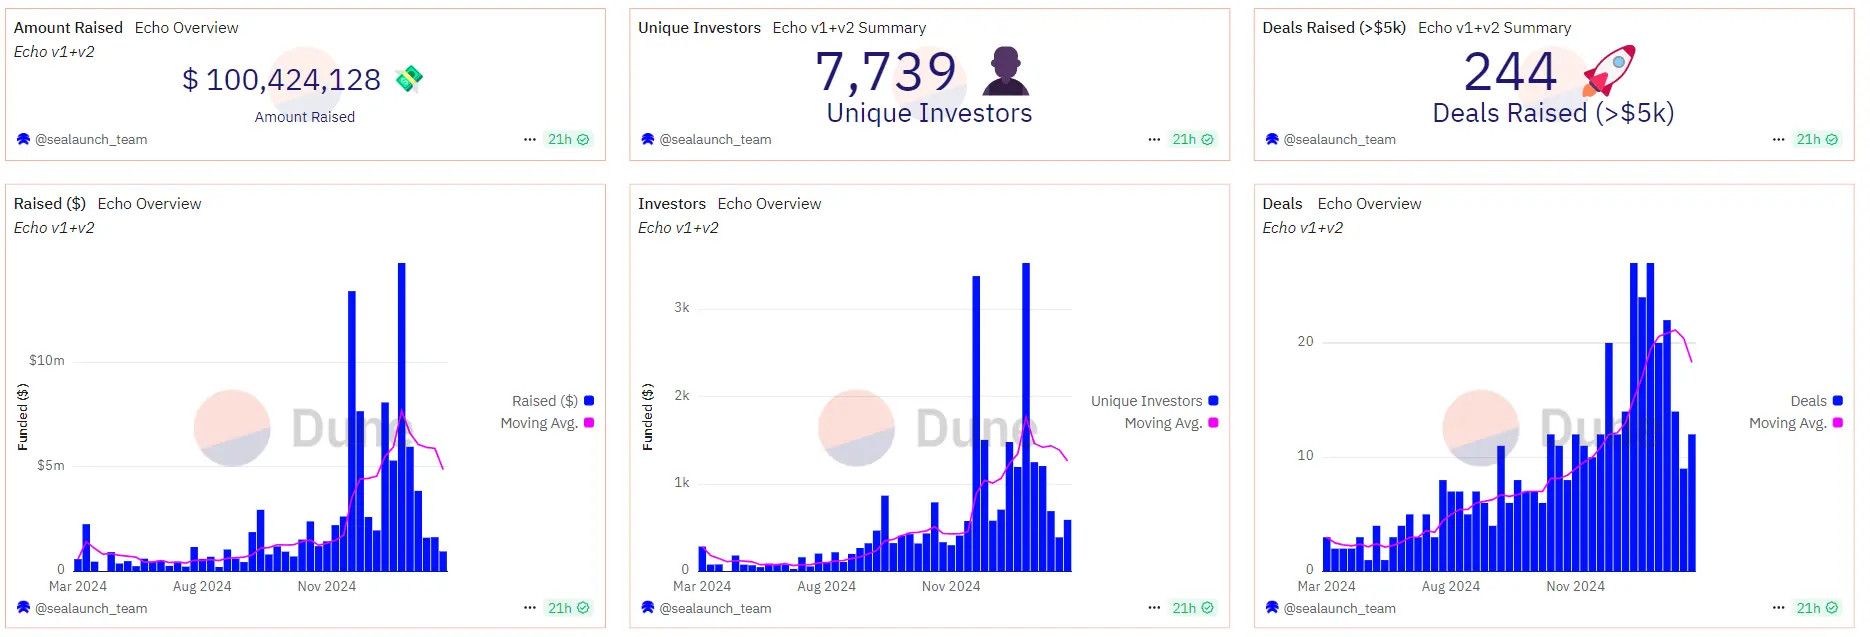
平均回報率達 400%,這三個收益超高的加密 IDO 平台你都知道嗎?
加密社區對“高估值、高 FDV、低流通量”的 VC 幣早已不滿,IDO 成為項目方吸引社區支持的熱門選擇,這也推動了 Echo、Legion、Buidlpad 等新興 IDO 平台的崛起。
Chaincatcher•2025-02-27 13:00
Bitget LaunchX 支持 Jambo 為衛星發射計劃籌集 500 萬美元
Zombit•2025-01-18 01:55

Bitget LaunchX 支持 Jambo 為衛星發射計劃籌集 500 萬美元
Abmedia•2025-01-17 20:00
FUELUSDT 現已上架合約交易和交易BOT
Bitget Announcement•2025-01-02 05:00

購買其他幣種


用戶還在查詢 Fuel Network 的價格。
Fuel Network 的目前價格是多少?
Fuel Network 的即時價格為 NT$0.35(FUEL/TWD),目前市值為 NT$1,568,155,439.23 TWD。由於加密貨幣市場全天候不間斷交易,Fuel Network 的價格經常波動。您可以在 Bitget 上查看 Fuel Network 的市場價格及其歷史數據。
Fuel Network 的 24 小時交易量是多少?
在最近 24 小時內,Fuel Network 的交易量為 NT$94.58M。
Fuel Network 的歷史最高價是多少?
Fuel Network 的歷史最高價是 NT$2.8。這個歷史最高價是 Fuel Network 自推出以來的最高價。
我可以在 Bitget 上購買 Fuel Network 嗎?
可以,Fuel Network 目前在 Bitget 的中心化交易平台上可用。如需更詳細的說明,請查看我們很有幫助的 如何購買 fuel-network 指南。
我可以透過投資 Fuel Network 獲得穩定的收入嗎?
當然,Bitget 推出了一個 策略交易平台,其提供智能交易策略,可以自動執行您的交易,幫您賺取收益。
我在哪裡能以最低的費用購買 Fuel Network?
Bitget提供行業領先的交易費用和市場深度,以確保交易者能够從投資中獲利。 您可通過 Bitget 交易所交易。
您可以在哪裡購買 Fuel Network(FUEL)?
影片部分 - 快速認證、快速交易

如何在 Bitget 完成身分認證以防範詐騙
1. 登入您的 Bitget 帳戶。
2. 如果您是 Bitget 的新用戶,請觀看我們的教學,以了解如何建立帳戶。
3. 將滑鼠移到您的個人頭像上,點擊「未認證」,然後點擊「認證」。
4. 選擇您簽發的國家或地區和證件類型,然後根據指示進行操作。
5. 根據您的偏好,選擇「手機認證」或「電腦認證」。
6. 填寫您的詳細資訊,提交身分證影本,並拍攝一張自拍照。
7. 提交申請後,身分認證就完成了!
加密貨幣投資(包括透過 Bitget 線上購買 Fuel Network)具有市場風險。Bitget 為您提供購買 Fuel Network 的簡便方式,並且盡最大努力讓用戶充分了解我們在交易所提供的每種加密貨幣。但是,我們不對您購買 Fuel Network 可能產生的結果負責。此頁面和其包含的任何資訊均不代表對任何特定加密貨幣的背書認可,任何價格數據均採集自公開互聯網,不被視為來自Bitget的買賣要約。
Bitget 觀點

BGUSER-J6T0BG2K
11小時前
$PARTI Coin has gained attention in the crypto market, with traders closely monitoring its next moves. The key question now is: Will $PARTI continue its bullish momentum, or is a bearish correction imminent?
To answer this, we will analyze multiple factors, including technical analysis, market sentiment, fundamental developments, and macroeconomic trends that could influence $PARTI’s next trading direction.
---
1. Current Market Trend: Bullish or Bearish?
The first step is to determine whether $PARTI is currently in an uptrend (bullish) or downtrend (bearish).
Bullish Signals:
✅ Higher Highs and Higher Lows – If the price is consistently making higher peaks and higher dips, it indicates a strong uptrend.
✅ Increasing Trading Volume – Rising volume confirms trader interest and indicates that the current trend may continue.
✅ Breakout Above Resistance Levels – If $PARTI has broken past key resistance levels and holds above them, it suggests further upside potential.
Bearish Signals:
❌ Lower Highs and Lower Lows – A pattern of declining peaks and dips suggests a weakening trend.
❌ Decreasing Volume – If trading activity starts dropping, it may indicate a lack of buying pressure.
❌ Failure to Hold Key Support Levels – If $PARTI falls below crucial support zones, it could trigger further selling pressure.
---
2. Technical Analysis: Key Indicators to Watch
Technical indicators provide deeper insights into $PARTI’s next possible price movement.
Moving Averages (MA)
Bullish Scenario: If the price is above the 50-day and 200-day moving averages, it suggests an uptrend.
Bearish Scenario: If $PARTI drops below these levels, a downtrend may follow.
Relative Strength Index (RSI)
RSI Above 70: Indicates overbought conditions → A potential correction might occur.
RSI Below 30: Indicates oversold conditions → A possible bounce or recovery could happen.
MACD (Moving Average Convergence Divergence)
Bullish Crossover: When the MACD line crosses above the signal line, it suggests upward momentum.
Bearish Crossover: If the MACD line crosses below the signal line, it signals potential downward movement.
Key Levels to Watch
Resistance Levels: If $PARTI breaks above these, it can continue its uptrend.
Support Levels: If it holds strong support, the price may bounce; otherwise, further decline is possible.
---
3. Fundamental Analysis: What’s Driving $PARTI’s Price?
Beyond technicals, fundamental factors play a major role in shaping $PARTI’s price direction.
Bullish Catalysts:
✅ Exchange Listings & Liquidity Boost – If $PARTI gets listed on more major exchanges, demand could increase.
✅ Upcoming Developments & Roadmap Execution – If the project announces major partnerships or new features, it can drive bullish sentiment.
✅ Strong Community & Hype – Increased social media activity, influencer support, and positive news can fuel a price surge.
Bearish Risks:
❌ Profit-Taking by Whales – Large holders may sell their holdings, leading to a short-term pullback.
❌ Regulatory Concerns – Any negative government policies or regulations affecting the crypto market could impact $PARTI.
❌ Market Correlation with Bitcoin (BTC) – If Bitcoin drops, many altcoins, including $PARTI, could follow the downward trend.
---
4. Market Sentiment: What Are Traders Expecting?
Market sentiment is crucial in predicting short-term price movements.
Bullish Sentiment: If traders on social media, trading forums, and Bitget Insight are highly optimistic, it could push prices higher.
Bearish Sentiment: If fear and uncertainty dominate the market, a sell-off may occur.
Whale & Institutional Activity
If large wallets are accumulating $PARTI, it indicates bullish confidence.
If whales are offloading large amounts, it suggests a bearish outlook.
---
5. Short-Term vs. Long-Term Predictions
Short-Term (Next Few Weeks):
Bullish Scenario:
If $PARTI maintains high trading volume and breaks key resistance levels, the price may continue upwards.
If technical indicators confirm a bullish trend, traders might push for another leg up.
Bearish Scenario:
If $PARTI struggles to hold support levels and volume declines, a correction could follow.
If RSI remains overbought, a temporary pullback is likely.
Long-Term (Next Few Months):
Bullish Outlook:
If the project continues growing its ecosystem, it could attract more investors.
If Bitcoin and the overall market enter an altcoin season, $PARTI could see massive gains.
Bearish Outlook:
If market-wide corrections occur or $PARTI fails to sustain momentum, its price may decline.
If major holders sell off, it could trigger a larger downtrend.
---
6. Trading Plan: How to Approach $PARTI Next?
If You Are Bullish:
Look for breakouts above key resistance levels and confirm with volume.
Use trend-following indicators like moving averages to enter trades.
Consider staking or holding long-term if the fundamentals remain strong.
If You Are Bearish:
Wait for pullbacks to key support levels before entering long positions.
Use stop-loss orders to protect your capital.
Consider shorting or hedging if indicators show weakness.
---
Conclusion: What’s Next for $PARTI?
🔹 If $PARTI maintains strong momentum, high volume, and positive sentiment, a bullish continuation is likely.
🔹 If trading volume decreases and key supports break, a short-term correction might occur before another leg up.
Final Thought:
For traders, the best approach is to follow technical signals, monitor fundamental news, and adapt to market conditions. Whether $PARTI remains bullish or faces a bearish correction will depend on how the market reacts in the coming days and weeks.
BTC-4.02%
FUEL-5.45%

TokenTalk
12小時前
$VIDT ROCKETS 35.87%: Mega Breakout Confirmed! How High Can It Go?
Market Bias: EXTREMELY BULLISH
Trading Signal (Long Setup)
Entry 1: $0.0200
Entry 2: $0.0194
Take Profit Targets:
TP1: $0.0220
TP2: $0.0250
TP3: $0.0280
TP4: $0.0300
Stop Loss: $0.0186
Why This Is a Must-Watch Trade
35.87% EXPLOSIVE MOVE - Biggest daily gain in weeks
BREAKING UPPER BOLLINGER BAND ($0.01941) - Extreme bullish momentum
10X VOLUME SPIKE - Strongest buying pressure since March
HEAVY SHORT INTEREST - Potential squeeze fuel
⚔️ Critical Levels
Support: 0.0194→0.0194→0.0186 → $0.0151
Resistance: 0.0220→0.0220→0.0250 → $0.0300
🌪️ Market Pulse
VIDT is going PARABOLIC:
• Just SMASHED through 0.0194 resistance
• Next target 0.0194 resistance
•Next target 0.0220 in sight TODAY
• Shorts getting wrecked - liquidation fuel building
• This could be the START of something BIG
#VIDT #AltcoinRocket #CryptoBreakout #LongVIDT #100xGems #FOMOAlert
X-11.18%
FUEL-5.45%

muphy
13小時前
$IMT Coin’s Next Move: Bullish Surge or Bearish Pullback?
With $IMT Coin gaining attention on Bitget, investors and traders are eager to know whether the token will experience a bullish surge or a bearish pullback. To answer this, we need to analyze key factors such as technical indicators, fundamental analysis, market trends, and external influences that may impact $IMT’s price movement.
---
1. Market Performance & Recent Price Action
As of now, $IMT Coin is experiencing notable trading activity, with price fluctuations that indicate both buying and selling pressure. Here’s what we know:
Recent Price Trends: $IMT has shown short-term gains but has also experienced corrections.
Trading Volume: A rise in volume can indicate strong interest, while a decline may signal weakening momentum.
Support & Resistance Levels: These define potential price zones where the token may either reverse direction or break through.
Bullish Indicators:
✅ If $IMT maintains higher lows and breaks key resistance levels, it may signal a bullish continuation.
✅ A rising RSI (Relative Strength Index) above 50 suggests increasing buying pressure.
✅ Moving Averages (50-day and 200-day) crossing upwards is a strong bullish signal.
Bearish Indicators:
⚠️ If $IMT struggles to hold support levels, it may indicate a pullback or correction.
⚠️ A declining MACD (Moving Average Convergence Divergence) could signal weakening momentum.
⚠️ If trading volume decreases, demand may be slowing down, leading to a price drop.
---
2. Technical Analysis: What Do the Charts Say?
Support & Resistance Levels
Strong Support Zone: If $IMT falls, look for price stabilization around major support zones where buyers may step in.
Major Resistance Levels: If $IMT is bullish, breaking resistance levels will be crucial for an upward move.
Bollinger Bands & RSI Analysis
If $IMT is near the upper Bollinger Band, it may be overbought, increasing the chances of a correction.
If RSI is above 70, the asset could be overbought, meaning a price pullback might be due.
If RSI is below 30, the asset could be oversold, indicating a potential buying opportunity.
---
3. Fundamental Analysis: What’s Driving $IMT’s Price?
Apart from technical factors, fundamental factors play a huge role in determining the next move for $IMT. Here’s what to consider:
Bullish Factors:
✅ Project Development & Use Case – If $IMT has a solid roadmap, utility, and real-world adoption, its value is likely to rise.
✅ Community Growth & Hype – A strong, active community and influencer backing can drive price appreciation.
✅ Exchange Listings & Partnerships – Listings on major exchanges like Binance or Coinbase could trigger a bull run.
Bearish Factors:
⚠️ Lack of Development – If $IMT’s project lacks updates, investors may lose confidence.
⚠️ Market Manipulation & Whale Movements – Large holders ("whales") can dump tokens, causing a price drop.
⚠️ Regulatory Issues – Stricter crypto regulations could negatively impact market sentiment.
---
4. External Market Influences
The crypto market is interconnected, meaning broader market trends will influence $IMT’s price direction.
Bitcoin’s Price Action – If Bitcoin is bullish, altcoins like $IMT tend to follow suit.
Macroeconomic Factors – Inflation, interest rates, and global financial events can impact investor sentiment.
Crypto Market Sentiment – Fear & Greed Index, social media trends, and major news announcements will shape $IMT’s next move.
---
5. Final Verdict: Will $IMT Surge or Drop?
If Bullish (Uptrend Scenario):
Key Resistance Breakout – If $IMT breaks above strong resistance, it could rally to new highs.
Sustained Volume Increase – A steady increase in buying volume confirms an uptrend.
Positive News/Partnerships – Announcements related to project development can fuel the rally.
If Bearish (Downtrend Scenario):
Failure to Hold Support – If $IMT loses key support levels, further declines are possible.
Decreasing Volume & Weak Momentum – A downtrend is likely if buying pressure weakens.
Market-Wide Selloff – If Bitcoin and major cryptos decline, $IMT could also drop.
---
Conclusion: What Should Traders & Investors Do?
1️⃣ Short-term Traders: Watch resistance levels for potential breakouts and place stop-loss orders to manage risk.
2️⃣ Long-term Investors: Assess the project’s fundamentals and hold only if you believe in its long-term potential.
3️⃣ Risk Management: Never invest more than you can afford to lose, and always have an exit strategy.
$IMT
FUEL-5.45%
HOLD-3.02%
muphy
14小時前
$PARTI Coin: Next Trading Plans – Are We Going Bullish or Bearish?
$PARTI Coin has gained attention in the crypto market, with traders closely monitoring its next moves. The key question now is: Will $PARTI continue its bullish momentum, or is a bearish correction imminent?
To answer this, we will analyze multiple factors, including technical analysis, market sentiment, fundamental developments, and macroeconomic trends that could influence $PARTI’s next trading direction.
---
1. Current Market Trend: Bullish or Bearish?
The first step is to determine whether $PARTI is currently in an uptrend (bullish) or downtrend (bearish).
Bullish Signals:
✅ Higher Highs and Higher Lows – If the price is consistently making higher peaks and higher dips, it indicates a strong uptrend.
✅ Increasing Trading Volume – Rising volume confirms trader interest and indicates that the current trend may continue.
✅ Breakout Above Resistance Levels – If $PARTI has broken past key resistance levels and holds above them, it suggests further upside potential.
Bearish Signals:
❌ Lower Highs and Lower Lows – A pattern of declining peaks and dips suggests a weakening trend.
❌ Decreasing Volume – If trading activity starts dropping, it may indicate a lack of buying pressure.
❌ Failure to Hold Key Support Levels – If $PARTI falls below crucial support zones, it could trigger further selling pressure.
---
2. Technical Analysis: Key Indicators to Watch
Technical indicators provide deeper insights into $PARTI’s next possible price movement.
Moving Averages (MA)
Bullish Scenario: If the price is above the 50-day and 200-day moving averages, it suggests an uptrend.
Bearish Scenario: If $PARTI drops below these levels, a downtrend may follow.
Relative Strength Index (RSI)
RSI Above 70: Indicates overbought conditions → A potential correction might occur.
RSI Below 30: Indicates oversold conditions → A possible bounce or recovery could happen.
MACD (Moving Average Convergence Divergence)
Bullish Crossover: When the MACD line crosses above the signal line, it suggests upward momentum.
Bearish Crossover: If the MACD line crosses below the signal line, it signals potential downward movement.
Key Levels to Watch
Resistance Levels: If $PARTI breaks above these, it can continue its uptrend.
Support Levels: If it holds strong support, the price may bounce; otherwise, further decline is possible.
---
3. Fundamental Analysis: What’s Driving $PARTI’s Price?
Beyond technicals, fundamental factors play a major role in shaping $PARTI’s price direction.
Bullish Catalysts:
✅ Exchange Listings & Liquidity Boost – If $PARTI gets listed on more major exchanges, demand could increase.
✅ Upcoming Developments & Roadmap Execution – If the project announces major partnerships or new features, it can drive bullish sentiment.
✅ Strong Community & Hype – Increased social media activity, influencer support, and positive news can fuel a price surge.
Bearish Risks:
❌ Profit-Taking by Whales – Large holders may sell their holdings, leading to a short-term pullback.
❌ Regulatory Concerns – Any negative government policies or regulations affecting the crypto market could impact $PARTI.
❌ Market Correlation with Bitcoin (BTC) – If Bitcoin drops, many altcoins, including $PARTI, could follow the downward trend.
---
4. Market Sentiment: What Are Traders Expecting?
Market sentiment is crucial in predicting short-term price movements.
Bullish Sentiment: If traders on social media, trading forums, and Bitget Insight are highly optimistic, it could push prices higher.
Bearish Sentiment: If fear and uncertainty dominate the market, a sell-off may occur.
Whale & Institutional Activity
If large wallets are accumulating $PARTI, it indicates bullish confidence.
If whales are offloading large amounts, it suggests a bearish outlook.
---
5. Short-Term vs. Long-Term Predictions
Short-Term (Next Few Weeks):
Bullish Scenario:
If $PARTI maintains high trading volume and breaks key resistance levels, the price may continue upwards.
If technical indicators confirm a bullish trend, traders might push for another leg up.
Bearish Scenario:
If $PARTI struggles to hold support levels and volume declines, a correction could follow.
If RSI remains overbought, a temporary pullback is likely.
Long-Term (Next Few Months):
Bullish Outlook:
If the project continues growing its ecosystem, it could attract more investors.
If Bitcoin and the overall market enter an altcoin season, $PARTI could see massive gains.
Bearish Outlook:
If market-wide corrections occur or $PARTI fails to sustain momentum, its price may decline.
If major holders sell off, it could trigger a larger downtrend.
---
6. Trading Plan: How to Approach $PARTI Next?
If You Are Bullish:
Look for breakouts above key resistance levels and confirm with volume.
Use trend-following indicators like moving averages to enter trades.
Consider staking or holding long-term if the fundamentals remain strong.
If You Are Bearish:
Wait for pullbacks to key support levels before entering long positions.
Use stop-loss orders to protect your capital.
Consider shorting or hedging if indicators show weakness.
---
Conclusion: What’s Next for $PARTI?
🔹 If $PARTI maintains strong momentum, high volume, and positive sentiment, a bullish continuation is likely.
🔹 If trading volume decreases and key supports break, a short-term correction might occur before another leg up.
Final Thought:
For traders, the best approach is to follow technical signals, monitor fundamental news, and adapt to market conditions. Whether $PARTI remains bullish or faces a bearish correction will depend on how the market reacts in the coming days and weeks.
BTC-4.02%
FUEL-5.45%

Cointribune EN
16小時前
Bitcoin ETF: A Decisive Turning Point With The Stabilization Of Flows
Like a tightrope walker swaying between two cliffs, Bitcoin ETFs evoke as much hope as chills. In recent weeks, a timid recovery of positive flows has given the market a semblance of breath. But behind this surge lies a darker reality, highlighted by CryptoQuant: Bitcoin exchange-traded funds (ETFs) are navigating a critical turbulence zone. Between deceptive stabilization and macroeconomic threats, BTC is walking a tightrope.
Since their launch, Bitcoin ETFs have embodied a revolution for institutional adoption. However, data from CryptoQuant reveals a mixed picture.
The first chart shows a drop of 12% from the historic high (ATH) reached in early 2025, amounting to nearly $5 billion evaporated.
A painful decline contrasting with the euphoria of the preceding months, marked by aggressive accumulation of bitcoin. Investors, once conquerors, now seem hesitant to nourish the giant.
The second chart drives the point home: while 2024 propelled net inflows to $30 billion, 2025 starts in troubled waters. Flows have reversed, plunging into negative territory.
A turnaround reminiscent of the upheavals in traditional markets facing persistent inflation or capricious interest rates. Institutions, caught between the desire for yield and risk aversion, are now playing for time.
Finally, the third chart offers an ambiguous glimmer: daily flows of Bitcoin ETFs are stabilizing, but in a fragile balance. Supply and demand remain lethargic, hanging by a thread.
“It’s the calm before the storm or the saving lull,” summarizes an analyst . In this context, every capital movement takes on the appearance of a roll of the dice.
Despite massive withdrawals, one detail intrigues: Bitcoin ETF holders remain predominantly profitable. The average breakeven price ($72,546) contrasts with the current $87,000 price of bitcoin, providing a latent margin of 17%.
A paradoxical situation: even in the event of panicked sales, most investors would come out winners. However, this profitability could also fuel an illusion of security, masking the market’s vulnerability.
The recent inflows of $800 million in eight days, however, shake up the forecasts. A resurgence that raises questions: is it a return of confidence or a final gasp before a retreat? Bitcoin, on its part, is struggling to gain a measly 2.4% over a week, moving within a narrow corridor. Like a sleeping volcano, its latent energy could explode… or extinguish.
Still, there is the macroeconomic variable, a sword of Damocles hanging over the ETFs. Amid geopolitical tensions and monetary uncertainties, institutional investors adjust their positions in real-time. Flows, now more responsive than ever, reflect this dance with the unpredictable.
Bitcoin ETFs today embody the paradox of a market that is both resilient and fragile. Their recent stabilization is neither a guarantee of sustainability nor a harbinger of chaos. Like a seismograph, it records the tremors of a transforming financial world.
The question is not whether a crash will occur, but how the market will digest these convulsions. Between fear and opportunity , bitcoin remains, more than ever, a mirror of our collective uncertainties. To be continued with a critical eye… and an agile portfolio.
BTC-4.02%
UP+1.13%
相關資產


相近市值
在所有 Bitget 資產中,這8種資產的市值最接近 Fuel Network。


