Bitget: ¡En el Top 4 por volumen de trading diario global!
Cuota de mercado de BTC60.77%
Nuevos listados en Bitget:Pi Network
Índice de la temporada de altcoins:0(Temporada de Bitcoin)
BTC/USDT$84236.14 (+2.87%)Índice de miedo y codicia46(Neutral)
Flujo neto total de ETF en spot de Bitcoin -$59.2M (1d); -$1.37B (7d). Monedas listadas en el pre-mercadoPAWS,WCTPaquete de obsequios de bienvenida para nuevos usuarios por valor de 6.200 USDT.Reclamar ahora
Tradea en cualquier momento y lugar con la app de Bitget. Descargar ahora

Relacionado con la moneda
Calculadora de precios
Historial de precios
Predicción de precios
Análisis técnico
Guía de compra de la moneda
Categoría cripto
Calculadora de ganancias
Relacionado con el trading
Comprar/vender
Depositar/retirar
Spot
Margen
Futuros USDT-M
Futuros Coin-M
Bots de trading
Copy trading
Earn
Pre-mercado
Actualizaciones de la moneda
Noticias de THE TICKER IS
Alerta de THE TICKER IS
Calendario de eventos
ICO
Airdrop


Precio de THE TICKER ISETH
No listado
Moneda de cotización:
USD
Los datos proceden de proveedores externos. Esta página y la información proporcionada no respaldan ninguna criptomoneda específica. ¿Quieres tradear monedas listadas? Haz clic aquí
$0.{7}7951+8.27%1D
Gráfico de precios
Última actualización el 2025-03-15 06:40:50(UTC+0)
Capitalización de mercado:--
Capitalización de mercado totalmente diluida:--
Volumen (24h):--
Volumen en 24h/Capitalización de mercado:0.00%
Máximo 24h:$0.{7}8452
Mínimo 24h:$0.{7}7806
Máximo histórico:$0.{5}4063
Mínimo histórico:$0.{7}6560
Suministro circulante:-- ETH
Suministro total:
100,000,000,000ETH
Tasa de circulación:0.00%
Suministro máx.:
--ETH
Precio en BTC:0.002501 BTC
Precio en ETH:1 ETH
Precio en la capitalización de mercado de BTC:
--
Precio en la capitalización de mercado de ETH:
--
Contratos:
0xC947...9810919(Ethereum)
¿Qué opinas hoy de THE TICKER IS?
Nota: Esta información es solo de referencia.
Precio actual de THE TICKER IS
El precio de THE TICKER IS en tiempo real es de $0.{7}7951 por (ETH / USD) hoy con una capitalización de mercado actual de $0.00 USD. El volumen de trading de 24 horas es de $0.00 USD. ETH a USD el precio se actualiza en tiempo real. THE TICKER IS es del 8.27% en las últimas 24 horas. Tiene un suministro circulante de 0 .
¿Cuál es el precio más alto de ETH?
ETH tiene un máximo histórico (ATH) de $0.{5}4063, registrado el 2024-10-27.
¿Cuál es el precio más bajo de ETH?
ETH tiene un mínimo histórico (ATL) de $0.{7}6560, registrado el 2024-10-28.
Predicción de precios de THE TICKER IS
¿Cuál será el precio de ETH en 2026?
Según el modelo de predicción del rendimiento histórico del precio de ETH, se prevé que el precio de ETH alcance los $0.{6}1015 en 2026.
¿Cuál será el precio de ETH en 2031?
En 2031, se espera que el precio de ETH aumente en un +20.00%. Al final de 2031, se prevé que el precio de ETH alcance los $0.{6}3145, con un ROI acumulado de +295.50%.
Historial del precio de THE TICKER IS (USD)
El precio de THE TICKER IS fluctuó un -95.71% en el último año. El precio más alto de en USD en el último año fue de $0.{5}4063 y el precio más bajo de en USD en el último año fue de $0.{7}6560.
FechaCambio en el precio (%) Precio más bajoPrecio más alto
Precio más bajoPrecio más alto 24h+8.27%$0.{7}7806$0.{7}8452
7d-18.24%$0.{7}7806$0.{7}9095
30d-25.21%$0.{7}7806$0.{6}1146
90d-70.45%$0.{7}7806$0.{6}4366
1y-95.71%$0.{7}6560$0.{5}4063
Histórico-94.71%$0.{7}6560(2024-10-28, 138 día(s) atrás )$0.{5}4063(2024-10-27, 139 día(s) atrás )
Información del mercado de THE TICKER IS
Capitalización de mercado de THE TICKER IS
Capitalización de mercado
--
Capitalización de mercado totalmente diluida
$7,950.79
Clasificación de mercado
Holdings de THE TICKER IS
Matriz de distribución de holdings de THE TICKER IS
Holdings por concentración de THE TICKER IS
Ballenas
Inversores
Minoristas
THE TICKER IS direcciones por tiempo en holding
Holders
Cruisers
Traders
Gráfico de precios de coinInfo.name (12) en tiempo real

Clasificación de THE TICKER IS
Clasificaciones promedio de la comunidad
5
Este contenido solo tiene fines informativos.
ETH a la moneda local
1 ETH a MXN$01 ETH a GTQQ01 ETH a CLP$01 ETH a UGXSh01 ETH a HNLL01 ETH a ZARR01 ETH a TNDد.ت01 ETH a IQDع.د01 ETH a TWDNT$01 ETH a RSDдин.01 ETH a DOP$01 ETH a MYRRM01 ETH a GEL₾01 ETH a UYU$01 ETH a MADد.م.01 ETH a AZN₼01 ETH a OMRر.ع.01 ETH a SEKkr01 ETH a KESSh01 ETH a UAH₴0
- 1
- 2
- 3
- 4
- 5
Última actualización el 2025-03-15 06:40:50(UTC+0)
Noticias de THE TICKER IS

Jasmy permite las transferencias nativas con CCIP de Chainlink
CryptoNewsNet•2025-03-15 04:22
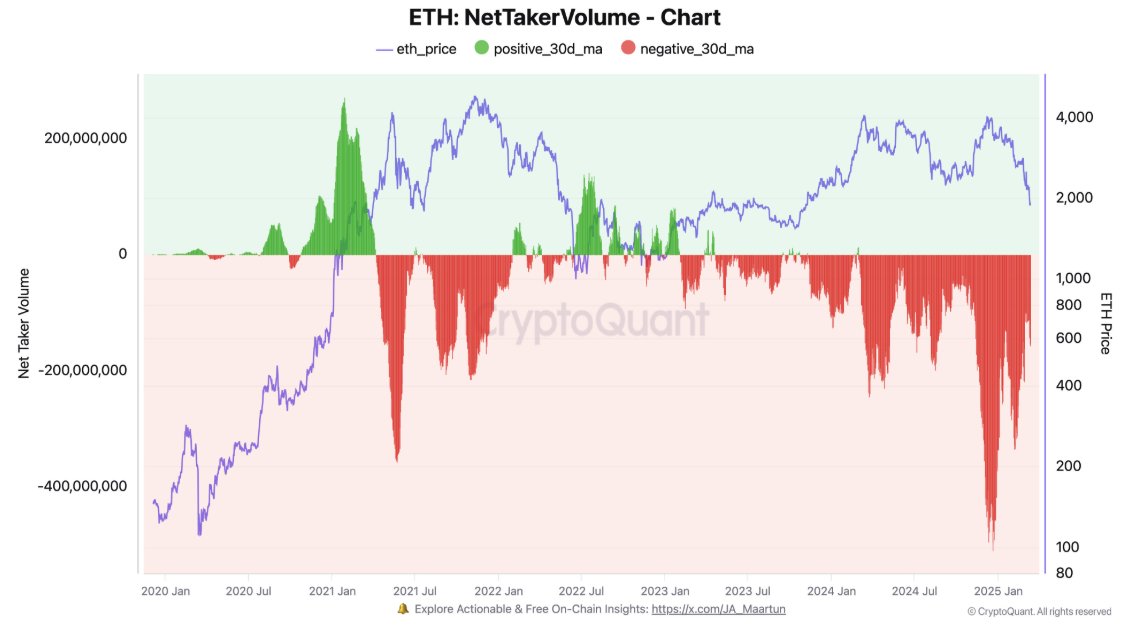
El dominio de mercado de Ethereum cae a mínimos de 2020: Analistas discuten factores clave
CryptoNewsNet•2025-03-15 04:22
Bolsas culpables de $ 4 millones de Hyperliquid $ 177k en nuevas ganancias – detalles
CryptoNewsNet•2025-03-15 04:22
9 tokens compradas por WLFI respaldadas por Trump sufren una pérdida de $ 124 millones
CryptoNewsNet•2025-03-15 04:22

Comprar más


Preguntas frecuentes
¿Cuál es el precio actual de THE TICKER IS?
El precio en tiempo real de THE TICKER IS es $0 por (ETH/USD) con una capitalización de mercado actual de $0 USD. El valor de THE TICKER IS sufre fluctuaciones frecuentes debido a la actividad continua 24/7 en el mercado cripto. El precio actual de THE TICKER IS en tiempo real y sus datos históricos están disponibles en Bitget.
¿Cuál es el volumen de trading de 24 horas de THE TICKER IS?
En las últimas 24 horas, el volumen de trading de THE TICKER IS es de $0.00.
¿Cuál es el máximo histórico de THE TICKER IS?
El máximo histórico de THE TICKER IS es $0.{5}4063. Este máximo histórico es el precio más alto de THE TICKER IS desde su lanzamiento.
¿Puedo comprar THE TICKER IS en Bitget?
Sí, THE TICKER IS está disponible actualmente en el exchange centralizado de Bitget. Para obtener instrucciones más detalladas, consulta nuestra útil guía Cómo comprar .
¿Puedo obtener un ingreso estable invirtiendo en THE TICKER IS?
Desde luego, Bitget ofrece un plataforma de trading estratégico, con bots de trading inteligentes para automatizar tus trades y obtener ganancias.
¿Dónde puedo comprar THE TICKER IS con la comisión más baja?
Nos complace anunciar que plataforma de trading estratégico ahora está disponible en el exchange de Bitget. Bitget ofrece comisiones de trading y profundidad líderes en la industria para garantizar inversiones rentables para los traders.
¿Dónde puedo comprar cripto?
Sección de video: verificación rápida, trading rápido

Cómo completar la verificación de identidad en Bitget y protegerte del fraude
1. Inicia sesión en tu cuenta de Bitget.
2. Si eres nuevo en Bitget, mira nuestro tutorial sobre cómo crear una cuenta.
3. Pasa el cursor por encima del ícono de tu perfil, haz clic en "No verificado" y haz clic en "Verificar".
4. Elige tu país o región emisora y el tipo de ID, y sigue las instrucciones.
5. Selecciona "Verificación por teléfono" o "PC" según tus preferencias.
6. Ingresa tus datos, envía una copia de tu ID y tómate una selfie.
7. Envía tu solicitud, ¡y listo! Habrás completado la verificación de identidad.
Las inversiones en criptomoneda, lo que incluye la compra de THE TICKER IS en línea a través de Bitget, están sujetas al riesgo de mercado. Bitget te ofrece formas fáciles y convenientes de comprar THE TICKER IS, y hacemos todo lo posible por informar exhaustivamente a nuestros usuarios sobre cada criptomoneda que ofrecemos en el exchange. No obstante, no somos responsables de los resultados que puedan surgir de tu compra de THE TICKER IS. Ni esta página ni ninguna parte de la información que incluye deben considerarse respaldos de ninguna criptomoneda en particular.
Bitget Insights

Bruiser_
12h
eth looks nice rn
ETH+0.91%
LOOKS+2.71%

Crypto-Ticker
12h
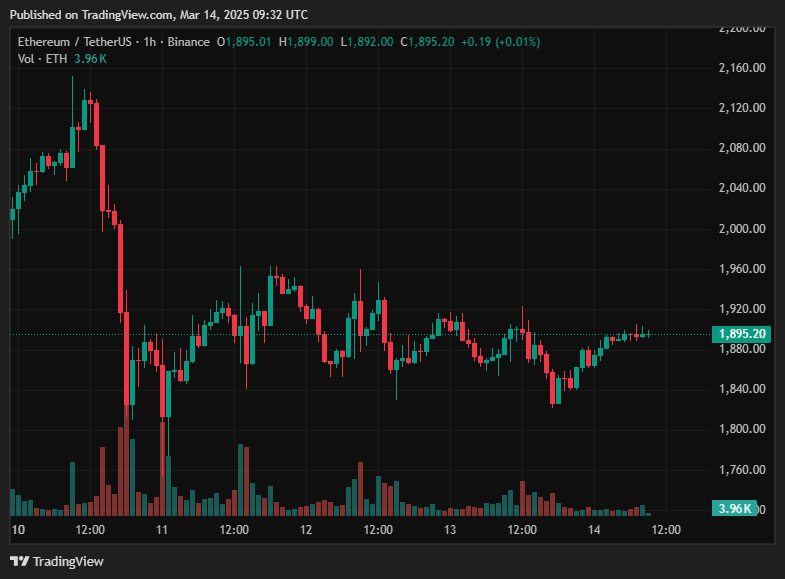
Ethereum Price Prediction: More Drops or a Rebound?
Ethereum (ETH), t he second-largest cryptocurrency by market cap, has been facing a significant downtrend, with its price recently dropping to $1,888. After an extended period of bearish momentum, traders are left wondering— will ETH bounce back, or is there more downside ahead?
The latest price action shows ETH struggling to hold above key support levels, while indicators such as RSI and MACD hint at potential oversold conditions. In this analysis, we’ll examine whether Ethereum is preparing for a relief rally or if the bearish pressure will continue to push it lower.
A crucial factor in determining Ethereum’s next move is the Relative Strength Index (RSI). Currently, the RSI stands at 25.12, which is deep in the oversold territory. Typically, an RSI below 30 signals that an asset is oversold, potentially triggering a short-term bounce as buyers look for discounted prices.
However, an oversold RSI alone doesn’t confirm a reversal. The key level to watch is whether ETH can push above the 30-35 RSI range, which would indicate returning bullish momentum. If RSI remains suppressed, ETH could continue its downward slide before finding a firm bottom.
The Moving Average Convergence Divergence (MACD) indicator paints a highly bearish picture. The MACD histogram is currently -193.6, indicating strong negative momentum. Additionally, the MACD line is far below the signal line at -18.8, reinforcing the bearish outlook.
For a trend reversal, we need to see the MACD line start curving upward and crossing above the signal line. Without this, Ethereum is likely to continue facing selling pressure, possibly testing lower support zones before a meaningful recovery.
Ethereum is currently testing a crucial support level around $1,850-$1,880. This zone has previously acted as strong support, and if ETH holds above it, we could see a short-term rebound toward $2,000-$2,100.
If the support fails, ETH could drop further, with the next major support at $1,700-$1,750. A breakdown below this level would put Ethereum in dangerous territory, potentially leading to a sharper sell-off toward $1,500.
On the upside, ETH faces resistance at $2,000, a psychological level that must be reclaimed for a bullish shift. If ETH breaks above this resistance and sustains momentum, it could pave the way for a recovery toward $2,250-$2,400.
The technical indicators suggest that Ethereum is at a critical inflection point. The deep oversold RSI hints at a potential short-term bounce, but the strong negative MACD momentum suggests continued bearish pressure.
For Ethereum to stage a recovery, it must hold above the $1,850 support and push past $2,000 to confirm bullish momentum. If it fails to do so, the bearish trend could extend toward $1,700-$1,750, leading to further downside risk.
Ethereum is currently facing intense selling pressure, but oversold conditions might provide an opportunity for a relief bounce. Traders should watch for RSI recovery above 30 and MACD signals of trend reversal before confirming a bullish stance. Until then, Ethereum remains vulnerable to further declines, with $1,850 as the key support zone to watch.
ETH+0.91%
MAJOR-2.37%

Showdown_pro
12h
$BTC Congratulations Guys.. 80,100 to 85,300 Our target has been achieved.
If you are New Better Read last post..
Yesterday When price came to 80,123 I was like oooopss 😂 , But Anyway this is the game I always Tell you Technical & Psychological supports and resistances are always different & It always Works.
Whenever I mention time, Sometimes 45 Minutes, sometimes 1 hour 30 Minutes Sometimes 4 Hours so most of the people Ask what is that shit. (You don't know that is why shit for you but still I will say Good luck to you)
I truly can't disclose this because this is just a crack a simple formula which you will also get to now after spending years of time on chart.
I mentioned in previous Post 13 Minutes for surprise, so one person asked after 4 hours where is the surprise?
So just look at that post timing and add 13 more minutes into it & open 1 minutes of candle, You will see that price didn't come below not even a single dollar.
So that is the reason I always want you to understand, only in confirmation I use high leverage otherwise proper risk management.
Anyway Soon I will share Rejection price Of BTC from where it will drop down.
Some people are disrespecting, just because I am new on Bitget but for them I would say I am in trading for last 8 Years & still learning.
IF you are day trader, swing trader I provide Daily, Weekly Monthly accurate zones of $BTC $ETH & some properly researched ALT coins
I provide this to only my Members with almost accurate Day.
Be a one to get Benefits.
Soon I will share about $$SOL $XRP
As always Trade Safe
Your Friend: Showdown_Pro
BTC+0.31%
ALT+2.22%

Smart-Scalper-Pro
12h
📢 Smart Trading is the Key to Success in Crypto! 🔑
Always remember:
When the market is in a downtrend, use DCA (Dollar Cost Averaging) and buy in small portions to get better entries at lower prices.
When the market starts moving upward, sell gradually in steps to secure profits without falling into FOMO.
Buying or selling everything at once often leads to losses because the market never moves in a straight line.
Always trade with a strategy and a plan, not emotions!
📊 Trade smart, earn smart! 💰
For more guidance, stay connected with SMART SCALPER PRO! 🚀
$BTC $ETH $LTC $BCH $ETC $BNB $BGB $SOL
BTC+0.31%
BGB+0.93%
BGUSER-M9J9P6GJ
13h
*Ethereum's (ETH) Price Under Scrutiny: Understanding the Recent Market Trends*
Ethereum's (ETH) price has been under intense scrutiny lately, with investors and analysts closely watching its every move. As one of the largest and most widely-used blockchain platforms, Ethereum's price fluctuations can have significant implications for the broader cryptocurrency market.
*Recent Market Trends*
To understand the recent market trends, let's take a closer look at Ethereum's price movements:
1. *Short-Term Volatility*: Ethereum's price has experienced significant short-term volatility, with prices fluctuating by as much as 10% within a single day.
2. *Downward Trend*: Despite occasional price surges, Ethereum's price has been trending downward over the past few months, with a decline of over 20% since its peak in February.
3. *Increased Trading Volume*: Ethereum's trading volume has increased significantly, indicating a high level of interest and activity in the market.
*Factors Influencing Ethereum's Price*
So, what's behind Ethereum's price fluctuations? Here are some key factors influencing its price:
1. *Regulatory Uncertainty*: Regulatory uncertainty, particularly in the United States, has contributed to Ethereum's price volatility. The lack of clear guidelines and regulations has created uncertainty among investors and traders.
2. *Competition from Other Blockchains*: Ethereum faces increasing competition from other blockchain platforms, such as Binance Smart Chain, Polkadot, and Solana. This competition has put pressure on Ethereum's price, as investors and developers consider alternative platforms.
3. *Technical Upgrades and Development*: Ethereum's technical upgrades and development, such as the transition to Ethereum 2.0, have been ongoing. While these upgrades aim to improve the platform's scalability and security, they can also create uncertainty and volatility in the short term.
*What's Next for Ethereum?*
As Ethereum's price continues to fluctuate, what can we expect in the future? Here are some possible scenarios:
1. *Recovery and Growth*: Ethereum's price may recover and grow as the platform continues to develop and improve. The transition to Ethereum 2.0, increased adoption, and growing demand for decentralized applications (dApps) could contribute to a price surge.
2. *Consolidation and Stability*: Ethereum's price may consolidate and stabilize, trading within a narrow range as investors and traders await further developments. This scenario could occur if the regulatory environment becomes clearer, and the platform's technical upgrades are completed successfully.
3. *Further Decline*: Ethereum's price may decline further if the platform faces significant competition, regulatory challenges, or technical issues. A decline in investor confidence, reduced adoption, or a decrease in demand for dApps could also contribute to a price decline.
*Conclusion*
Ethereum's price has been under intense scrutiny lately, with investors and analysts closely watching its every move. As one of the largest and most widely-used blockchain platforms, Ethereum's price fluctuations can have significant implications for the broader cryptocurrency market.
While Ethereum's price may continue to fluctuate in the short term, its long-term prospects remain promising. The platform's ongoing technical upgrades, growing adoption, and increasing demand for dApps could contribute to a price surge in the future.
*FAQs*
Q: What's behind Ethereum's recent price fluctuations?
A: Ethereum's price fluctuations can be attributed to various factors, including regulatory uncertainty, competition from other blockchains, and technical upgrades.
Q: What's the outlook for Ethereum's price in the future?
A: Ethereum's price may recover and grow as the platform continues to develop and improve. However, it's also possible that the price may consolidate and stabilize or decline further due to various challenges.
Q: How does Ethereum's price impact the broader cryptocurrency market?
A: As one of the largest and most widely-used blockchain platforms, Ethereum's price fluctuations can have significant implications for the broader cryptocurrency market.
MOVE+4.63%
ETH+0.91%
Activos relacionados
Criptomonedas populares
Una selección de las 8 criptomonedas principales por capitalización de mercado.


Agregada recientemente
Las criptomonedas agregadas más recientemente.


Capitalización de mercado comparable
Entre todos los activos de Bitget, estos 8 son los más cercanos a THE TICKER IS en capitalización de mercado.


.png)


